
In the above graph, the filled circles are measured data, and the lines are model fits with 4 free parameters.
Sample IV curves for a bolometer at multiple temperatures:
In the above graph, the filled circles are measured data, and the lines are
model fits with 4 free parameters.
The preliminary summary of bolometer parameters is as follows:
G0 test array 5347 LH1
Data at 330, 440, 597, 742, 985, 4243 mK (pixels 1-16)
Data at 329, 448, 604, 744, 974, 4261 mK (pixels 17-32)
Updated 21 Apr 2000, 09:45 PDT

R = R0 exp(sqrt(T0/T))
G = G0 T^beta

                        R*
          R0    T0    0.3 K   G0=G(1 K)          G(0.3 K)*  G(0.5 K)
bol/grp  ohms    K    Mohms  W/K^(beta+1)  beta     W/K       W/K
-------  ----  -----  -----  ------------  ----  ---------  ---------
01  mem. 1844  26.25   21.3    23.3 e-9    0.55  12.1  e-9  15.9  e-9
02  ??   1290  25.58   13.2     1.07e-9    1.32
03  ??   1365  25.51   13.8     1.20e-9    1.19   0.29 e-9   0.53 e-9
04  ??   1401  25.31   13.7     0.94e-9    1.15
05  3D   1953  26.94   25.5    24.4 e-9    1.97
06  3D   1956  27.16   26.5    24.1 e-9    1.96   2.28 e-9   6.19 e-9
07  3D   2147  27.11   28.9    19.4 e-9    1.77
08  3C   2127  26.93   27.7     2.24e-9    1.20
09  3C   1844  27.58   26.9     2.66e-9    1.38   0.51 e-9   1.02 e-9
10  3C   1898  27.05   25.2     2.61e-9    1.35
11  3B   1934  28.40   32.5    24.2 e-9    2.03
12  3B   1908  28.51   32.7    25.1 e-9    2.06   2.10 e-9   6.02 e-9
13  3B   1869  28.76   33.4    27.8 e-9    2.14
14  3A   1840  28.67   32.4     4.08e-9    1.44
15  3A   1951  28.41   32.9     3.80e-9    1.42   0.69 e-9   1.42 e-9
16  3A   1924  28.37   32.2     3.89e-9    1.41
17  2D   1893  28.73   33.7    38.4 e-9    2.63
18  2D   1899  28.90   34.8    38.7 e-9    2.66   1.57 e-9   6.12 e-9
19  2D   1981  28.82   35.8    36.7 e-9    2.65
20  2C   2025  28.51   34.7     1.17e-9    1.35
21  2C   1839  28.97   34.1     1.31e-9    1.43   0.23 e-9   0.49 e-9
22  2C   1920  28.91   35.2     1.26e-9    1.40
23  2B   1957  29.47   39.4     1.21e-9    1.37
24  2B   2038  29.15   38.9     1.17e-9    1.34   0.23 e-9   0.46 e-9
25  2B   1929  29.84   41.4     1.25e-9    1.40
26  2A   1871  30.40   44.0    42.4 e-9    2.76
27  2A   2019  29.93   44.0    37.3 e-9    2.62   1.59 e-9   6.07 e-9
28  2A   1952  30.41   46.0    40.0 e-9    2.69
29  1A   1836  31.16   49.0    20.0 e-9    2.74
30  1A   1788  31.95   54.2    20.7 e-9    2.80   0.71 e-9   2.97 e-9
31  1A   1927  31.34   52.9    18.1 e-9    2.68
32  mem. 1814  32.12   56.5    72.9 e-9    1.58  10.9  e-9  24.4  e-9

* extrapolation
           Resistance
Bolometer     Mohm
---------  ----------
    1         15.6
    9         19
   12         23
   15         22
   24         28
   32         36.4

Other changes to the system include using only 3 of 4 G10 support tubes, only 2 of 4 manganin cables, avoidance of the surface mount connectors on the detector board, and using gold leaf between the INVAR base plate, detector board, heat strap, and GRT interfaces.
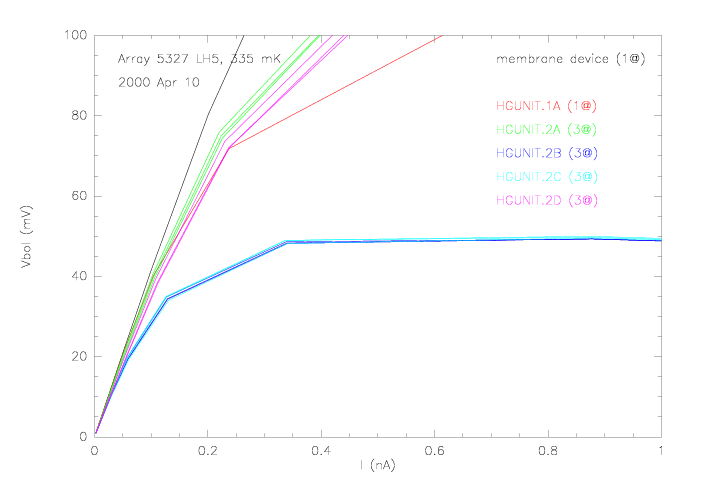
Sample IV curves for all bolometers at a single temperature:
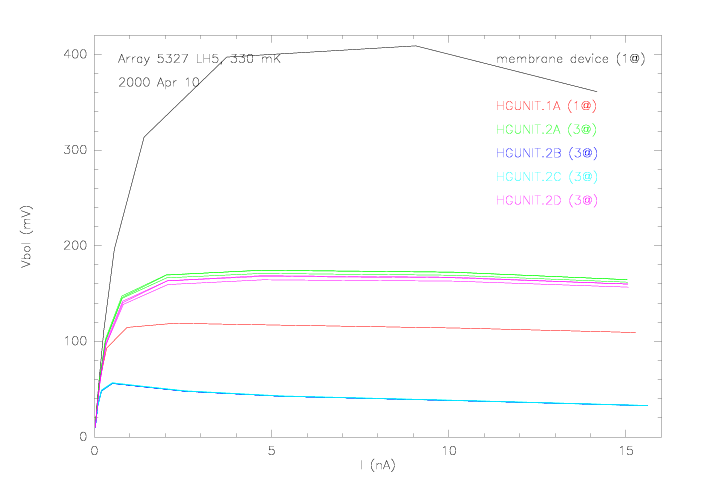
IV curves for a bolometer at multiple temperatures:

In the above graph, the filled circles are measured data, and the lines are
model fits with 4 free parameters.
The preliminary summary of bolometer parameters is as follows:
G0 test array 5327 LH5
Data at 328, 342, 389, 467, 651, 860, 962, 4127 mK
Updated 16 Apr 2000, 16:10 PDT

R = R0 exp(sqrt(T0/T))
G = G0 T^beta

            R0    T0     G0=G(1 K)          G(0.3 K)*  G(0.5 K)
bol./grp.  ohms    K    W/K^(beta+1)  beta     W/K       W/K
---------  ----  -----  ------------  ----  ---------  ---------
17  2D     1175  51.70    65.6 e-9    2.92
18  2D     1193  51.94    65.5 e-9    2.91   1.97 e-9   8.71 e-9
19  2D     1242  50.99    63.5 e-9    2.79
20  2C     1400  49.64     1.61e-9    1.24
21  2C     1271  51.22     1.70e-9    1.36   0.33 e-9   0.66 e-9
22  2C     1275  51.06     1.72e-9    1.35
23  2B     1354  50.20     1.65e-9    1.29
24  2B     1403  49.92     1.62e-9    1.28   0.35 e-9   0.67 e-9
25  2B     1304  50.94     1.67e-9    1.35
26  2A     1228  52.05    63.8 e-9    2.88
27  2A     1291  51.77    62.0 e-9    2.83   2.05 e-9   8.72 e-9
28  2A     1268  51.47    63.7 e-9    2.80
29  1A     1232  52.47    25.4 e-9    2.69   1.00 e-9   3.93 e-9
32  mem.   1243  52.25   128   e-9    2.40   7.12 e-9  24.3  e-9

* extrapolation; may not be accurate
Here is a Postscript summary of the bolometer recipes to associate with the group specification in the above table.
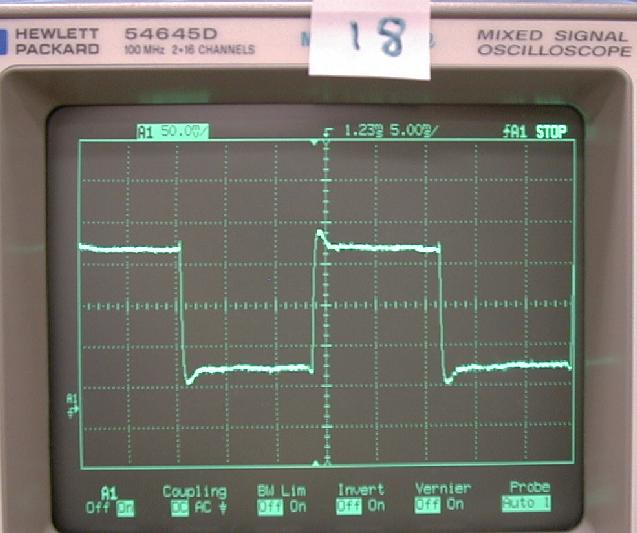
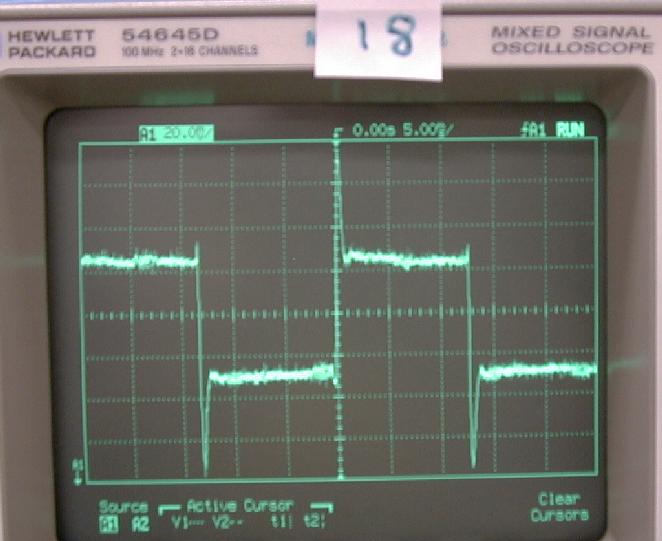
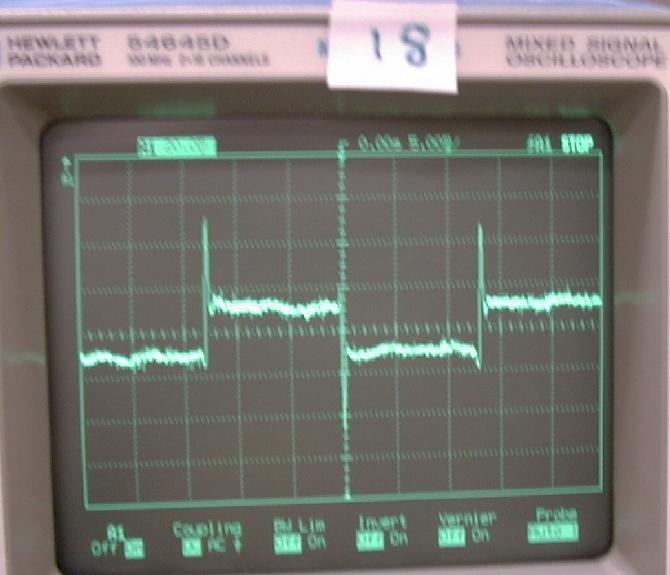
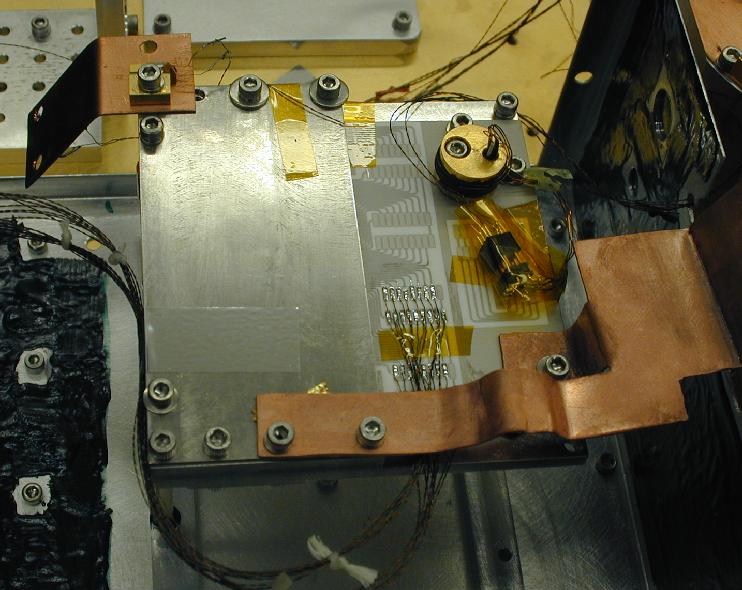
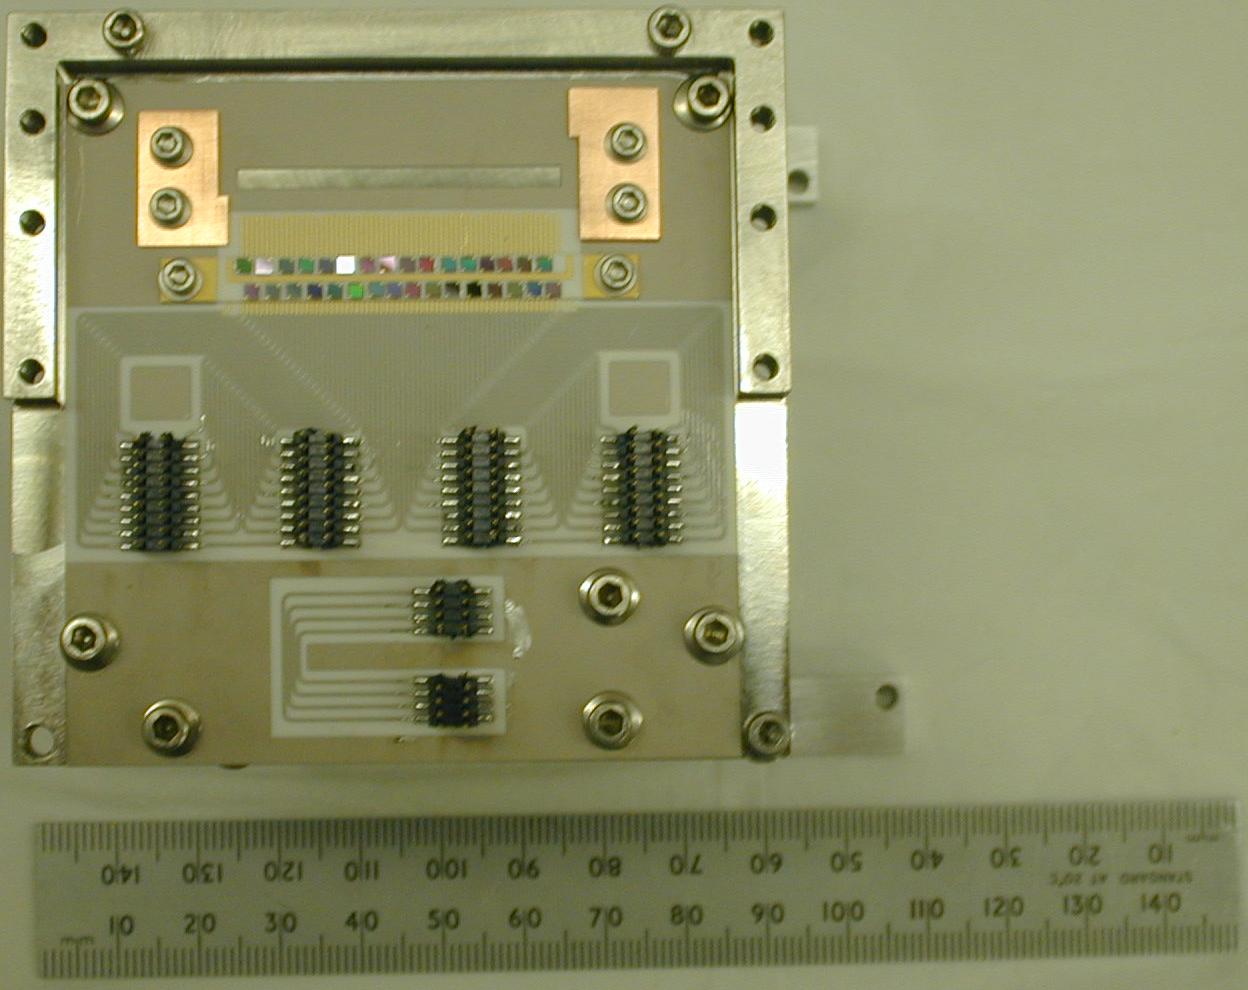
Photos:


 graph of R vs. T

A fit to the data with good thermometry yields:
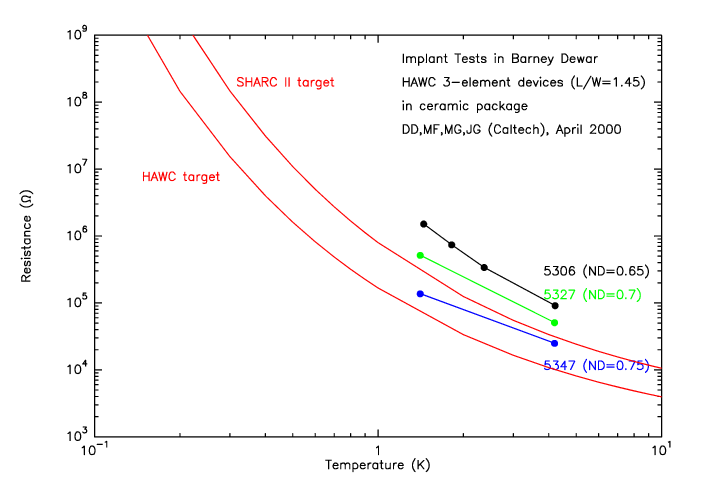
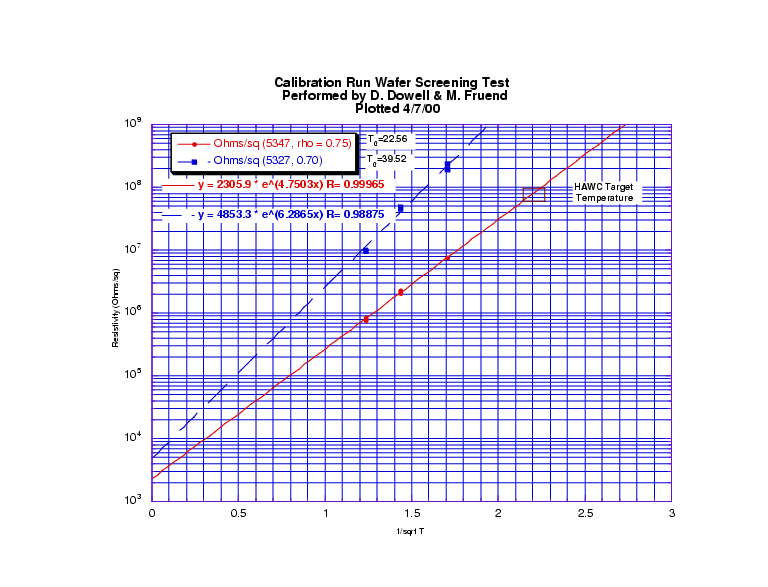
Label   ND   R0 (ohms)  T0 (K)
-----  ----  ---------  ------
5250a  0.6     2570      81.8
5250b  0.6     3880      74.6
5327   0.7     1750      48.9
5347   0.75    2090      25.7
Additional plots:
Christine's plot 4/07/00
Mino's ND=0.7 PDF plot
Mino's ND=0.75 PDF plot
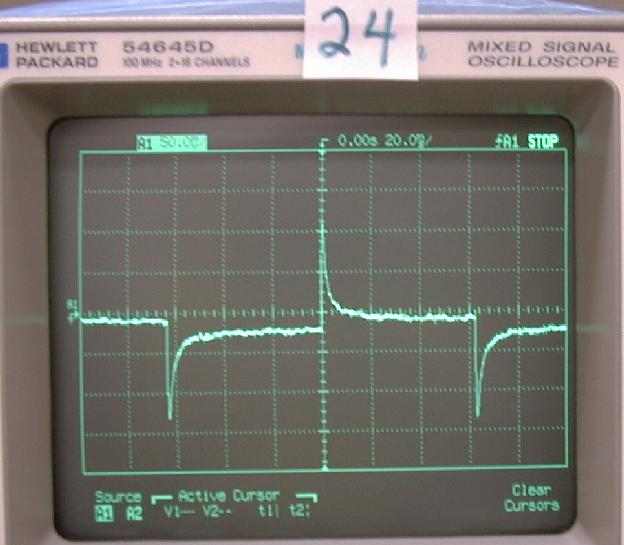
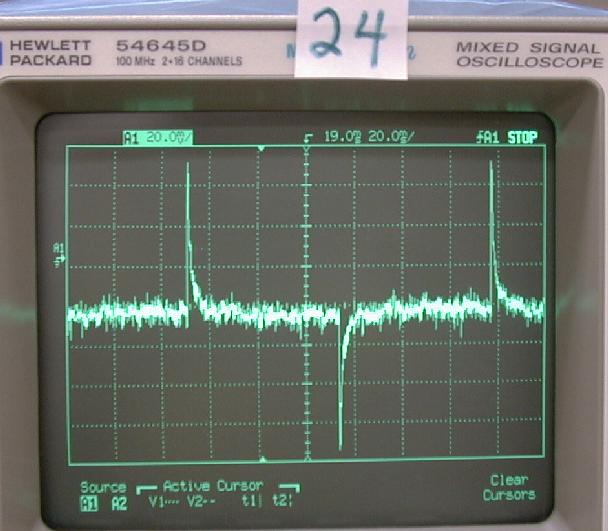
Photos:


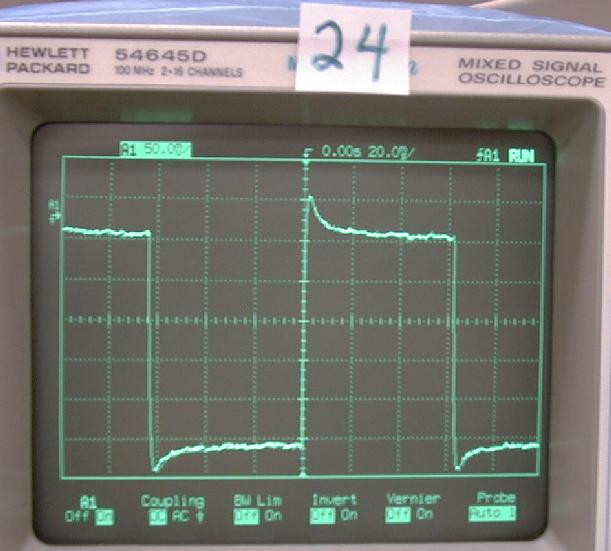
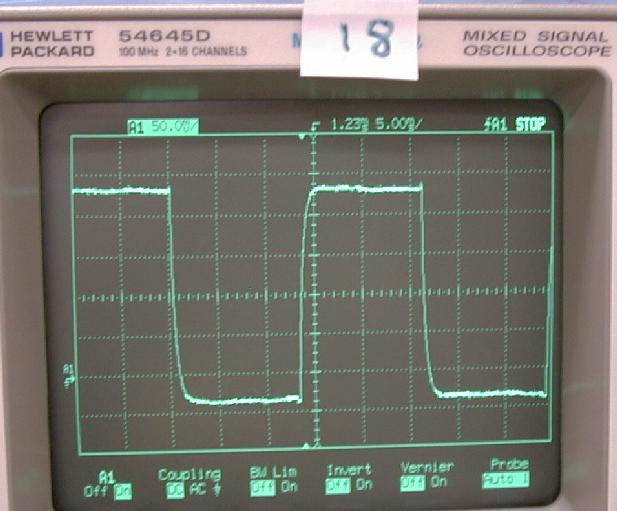
Photo:

A fit to the data from the purple Dewar experiment only yields:
Label   ND   R0 (ohms)  T0 (K)
-----  ----  ---------  ------
5306   0.65    1670      67.3
5327   0.7     2100      42.7
5347   0.75    2380      23.2
Since we will only have JFET modules to service 16 bolometers, two cooldowns will be required to test a single array. Given two arrays, we will need 4 cooldowns, with tests lasting approximately 1 month.
 graph of R vs. T