Characteristics of sichrome resistors measured by D. Dowell
The sichrome resistors could be useful for large load resistors for
the semiconductive pop-up arrays.
Darren Dowell -- (626)395-6675 (office), -2600 (lab), 796-8806 (FAX)
Last modified Thursday, 12-Dec-2000 10:30 PST
cdd@submm.caltech.edu
Cold noise spectra (SiCr on quartz) -- July 2000
Resistor 3/43 was connected in series with a 30 Mohm nichrome resistor
(simulating a bolometer),
and resistor 3/44 was connected in series with a 30 Mohm resistor. The
outputs of the 2 voltage dividers were routed to the inputs of a differential
amplifier.
Cold noise spectrum.
Raw data and Postscript figure available here.
The rise in noise toward low frequencies for the case of 0 V bias is probably
due to amplifier noise. The excess of low frequency noise for f < 1 Hz with
the 5 V bias could be due to bias amplitude noise or due to current noise in
one of the resistors. The high frequency junk is microphonic response of
vibrating cables.
Tests of devices on quartz -- March 2000
Seven devices (6 good) were obtained from M. Jhabvala in Mar. 2000. They are
long resistors with patterned SiCr on quartz substrates, glued to a metal
package. The box was labeled "HAWC // RL // W2 // Row 2,3 // Run M1
// 3/9/00 MJ".
row/column     R at 300K      comments
----------     ----------     --------
2/6            408.1 Mohm
2/7            402.1
2/8            387.4
2/10           *inf.*         saw cut
3/43           699.1
3/44           691.7
3/45           682.7
Resistance vs. temperature.
Raw data and Postscript figure available here.
Noise spectrum with grounded resistor terminal. The noise spectrum of the
SiCr on quartz resistor (black curve) is similar to that of a Victoreen MOX
resistor (blue curve)
of the same value. (The Victoreen spectrum has microphonic spikes which can
be ignored.) The spectra roll off as frequency^-1, as expected for a simple
RC filter. The corner frequency implies a capacitance from the JFET gate to
ground of 23 pF, which could be entirely due to the JFET. For comparison, the
unusual frequency dependence of the SiCr on Si resistor is shown (green curve).
There is an indication of some shunt capacitance across the resistor from
this test. Otherwise, the output would fall as frequency^-1. However, the
shunting effect is not as severe as for the devices with Si substrate (green
curve).
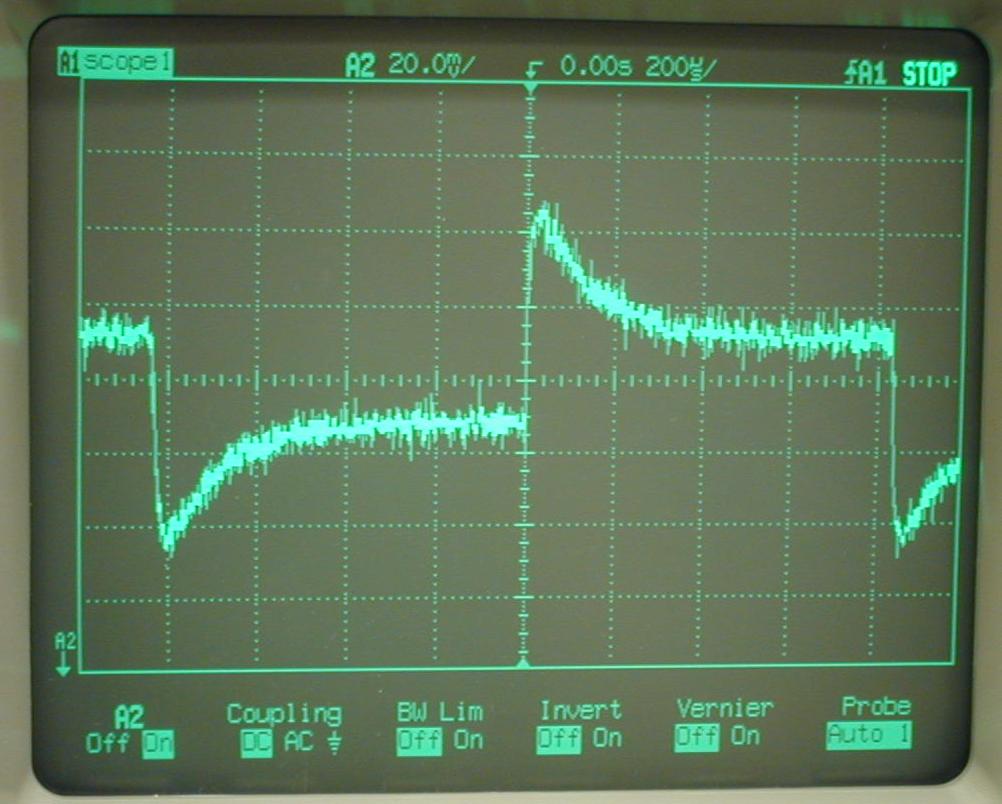
The glitches on transitions indicate a small shunt capacitance across the
terminals of the load resistor (387 Mohm).
TENTATIVE CONCLUSION: These resistors on quartz are significantly better than
the devices on silicon. They are suitable for SHARC2 (and HAWC as far as I
understand the requirements). The capacitance from one terminal to the other
will hopefully be reduced in the actual array package. I have approximately
20 pF of JFET gate capacitance which limits the knowledge of the capacitance
from a resistor terminal to ground.
Tests of 500 Mohm samples at 1.5K -- December 1999
Eight devices (6 good) were obtained from M. Jhabvala in Oct. 1999. The
plastic case they were transported in was labeled
"HAWC RL 10/99 MDJ NASA/GSFC". The
resistors were patterned on silicon dies approximately 1 inch long by MSI.
They were glued to a hefty metal package and wire bonded to solder leads.
Here are the row/column numbers of the devices:
row/column     location           comments
----------     --------------     --------
3/73           A side, edge
2/78           A side, (next)     lower resistance
2/79           A side, (next)     die damage; tap for ~1/3 of resistor
3/79           A side, middle
               B side, edge       no continuity
3/59           B side, (next)
3/60           B side, (next)
3/64           B side, middle
Resistance vs. temperature for large MSI sichrome resistors.
There was no significant variation in resistance with voltage from 0.1 V
applied to 30 V applied, except for a drop in resistance at the coldest
temperature for V > 10 V. (Probably due to self-heating.)
According to MSI, wafer 'A' had 1370 ohms/square, and wafer 'B' had 1200
ohms/square. (Do those 'A' and 'B' designations correspond to the hand-written
designations on the package? I assume so.) It appears that the resistance
correlates with both wafer designation and row. 'A/3' is highest, 'B/3' is
intermediate, and 'A/2' is lowest. The temperature behavior of the resistance
is quite similar for all of the devices.
Noise measurements. Four resistors were chosen for noise tests in a bridge
configuration (3/73, 3/79, 3/59, 3/60). In the bridge circuit, noise in any
one of the four resistors will appear at the output of the amplifier.
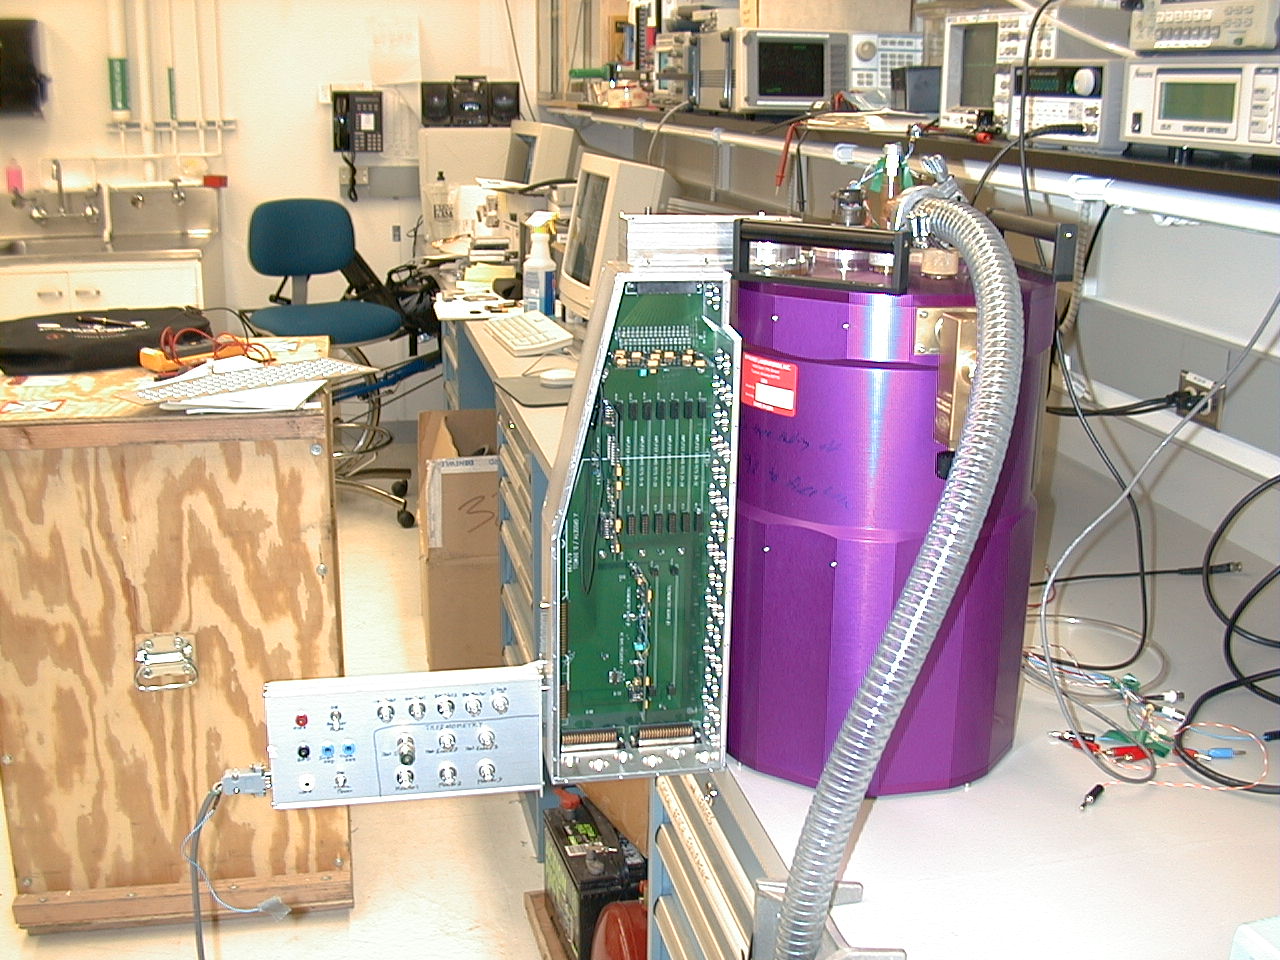
The resistors and JFETs were located inside an IR Labs HDL-10 dewar and
read out with the SHARC2 prototype electronics and a Stanford Research
spectrum analyzer. The resistors were cooled to 1.4 K.
Three bias voltages were applied to the bridge: 0 V, 2 V, and 5 V. With
a bias of 0 V, only Johnson noise should appear in the spectrum. With a
nonzero bias, resistance fluctuations should also be evident in the spectrum.
There was no observed voltage dependence of the noise spectrum down to
0.3 Hz, indicating low noise/stable resistors. However, the spectrum begins
to roll off at the very low frequency of 3 Hz, presumably due to
parasitic capacitance in the vicinity of the resistors. The
frequency dependence is f^-1/2 rather than the f^-1 expected for a simple
RC lowpass filter. This is potentially caused by the capacitance being
distributed.
In order to diagnose the capacitance, the room temperature noise of a single
sichrome resistor was compared with that of a Victoreen MOX resistor in a
radial lead package. The sichrome resistor had the same f^-1/2 rolloff as
at cold temperatures, while the MOX resistor had a simple RC (f^-1) rolloff
with a total capacitance of 12 pF. This indicates that the sichrome resistor
is responsible for the strange frequency behavior and not the amplifier.
A measurement of the short resistor (low value) also displayed the same
behavior.
Tests of frequency response (not shown here) indicate large (>10 pF)
capacitance from the resistor to ground and across the terminals of the
resistor. CONCLUSION: This device is unsuitable for use in
SHARC II due to large parasitic capacitance.
Tests of 20 Mohm samples at 1.5K -- May 1999
The samples: 20 Mohm +- 1%, part number MSHR 4SS-20004F-G, date code 9844,
lot #A1634C-9
Resistance vs. temperature for two MSI 20 Mohm sichrome resistors in series
Resistance vs. temperature for two MSI 30 Mohm nichrome resistors in series,
for comparison
An AC bridge circuit was used to measure the low-frequency Delta(R)/R
stability at 1.5K:
The AC waveform is digitized at 1 kHz and demodulated with a DSP (the
KAO data system).
The noise spectrum for the resulting quasi-DC output, with a +-0.49V bias
across the bridge at 50 Hz, is as shown:
The resistance appears to be very stable on time scales up to a few minutes.
For comparison, here is the spectrum with the AC component turned off, which
should only be sensitive to the noise at 50 Hz:
I don't understand why the noise seems to be ~50% higher than the
expected Johnson noise.
This could be due to an incorrect conversion of ADU to V, a missing factor of
sqrt(2) in the Fourier transform, or noise at frequencies other than 50 Hz
entering the system. In any case, the noise for AC bias on and off is the
same, which is an indication of resistance stability.
At attempt to confirm the noise with a DC measurement was made. DC bias
voltages of 0V and 0.49V were applied to the bridge. The output of the
preamplifier was sampled with a spectrum analyzer:
The noise spectra for the non-zero and zero bias overlap, meaning that no
current noise is evident. The horizontal line indicates the Johnson
noise predicted from the temperature and resistance, which is in very
good agreement for frequencies above 5 Hz.
Assuming that the voltage noise due to resistance fluctuations is < 30
nV/sqrt(Hz) at all frequencies, then the limit on delta(r)/r is
9x10^-8/sqrt(Hz). (Calculated with delta(r)/r = sqrt(2) delta(v)/v.)
Tests of 150 Mohm samples at 0.35K -- August 1999
The samples: 150 Mohm +- 1%, part number MSHR 4SS-15005F-E, date code 9924,
lot #A1202C-3
Resistance vs. temperature for two MSI 150 Mohm sichrome resistors in
series. The two samples had resistances differing by ~7% at
the cold temperatures.
The AC bridge circuit was used to measure the low-frequency Delta(R)/R
stability at 0.35K.
The noise spectrum for the resulting quasi-DC output, with a +-0.42V bias
across the bridge at 7 Hz, is as shown:
A scaling factor has been applied to the data to bring the
high-frequency white noise to the correct level.
The resistance appears to be stable on time scales up to a 10 seconds. For
longer time scales, some part of the system has a drift, possibly the
bias generator. Here is the output signal prior to Fourier transforming:
DC measurements were also made. DC bias
voltages of 0V, 1.5V, and 3.0V were applied to the bridge. The output of the
preamplifier was sampled with a spectrum analyzer:
The horizontal line indicates the Johnson noise predicted from the temperature
and resistance, which is in good agreement with the noise for 0V bias. For
the higher bias voltages, however, there is excess noise. This could be
due to bias voltage drifts.
The falling noise at high frequencies is due to capacitive shorting of the
signal to the FET gate. The corner frequency is at approximately 70 Hz,
which implies a capacitance of 23 pF. A DC impedance of 100 Mohms was assumed.
Go to SHARC II home page...