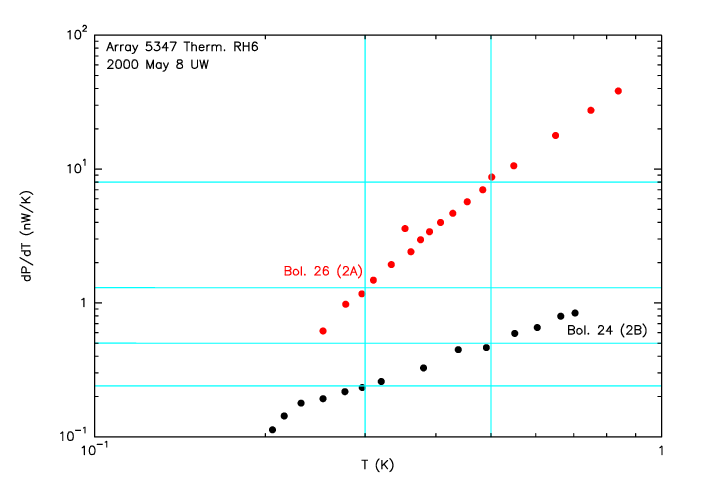
The fit parameters for the U. Wisconsin data are compared to the median Caltech results below. Both samples came from wafer 5347. Wisconsin measured RH6, and Caltech measured RH7.
                        R      R
          R0    T0    0.3 K  0.5 K   G0=G(1 K)          G(0.3 K)   G(0.5 K)
bol/grp  ohms    K    Mohms  Mohms  W/K^(beta+1)  beta     W/K       W/K
-------  ----  -----  -----  -----  ------------  ----  ---------  ---------
UW26 2A  1865  32.87   65.5   6.19    88.9 e-9    3.50   1.31 e-9   7.84 e-9
CIT  2A  1952  30.40   44.0   4.55    40.0 e-9    2.69   1.57 e-9   6.20 e-9

UW24 2B  1650  34.72   77.6   6.86     1.40e-9    1.52   0.22 e-9   0.49 e-9
CIT  2B  1957  29.47   39.4   4.22     1.21e-9    1.37   0.23 e-9   0.47 e-9
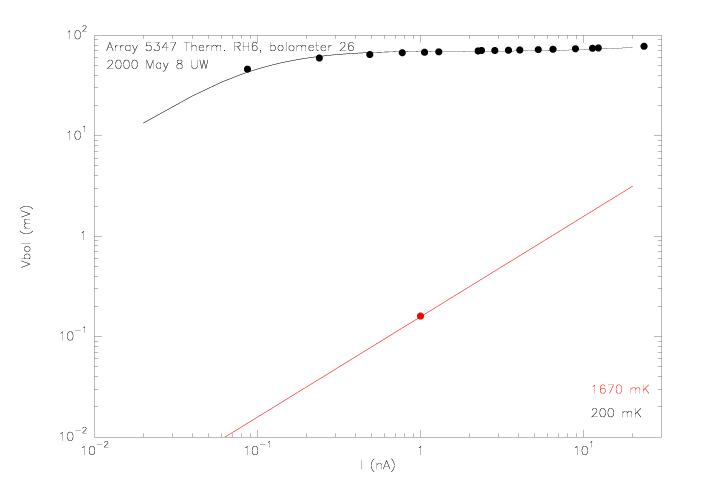
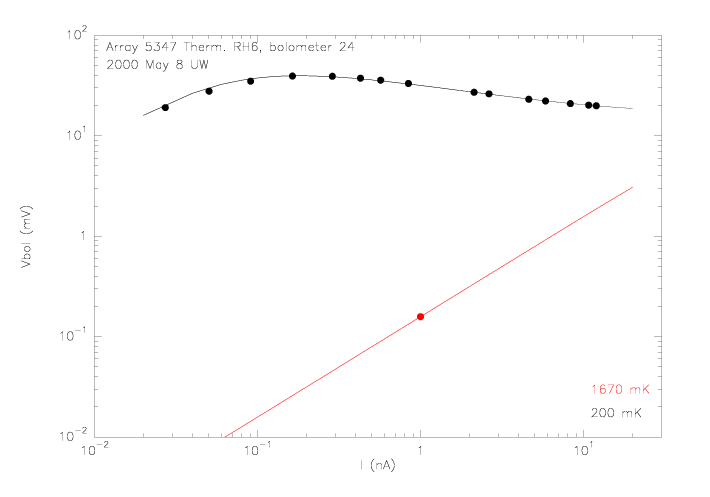
         R(0.229K)  R(1.67K)   R0    T0
bol/grp     Mohm      Mohm    ohms    K
-------  ---------  --------  ----  -----
UW  avg     322      0.157    1771  33.59