Dish Surface Optimization System
BOLOCAM Bolometer Camera
Bolocam is a new large-format bolometric camera for
observations at 1.1 and 2.1 mm at the CSO. The camera has 115 working pixels
with 8' FOV (approximately circular). The FWHM beam size is 30'' at 1.1 mm and
60'' at 2.1 mm. At all wavelengths, the pixel spacing (nearest neighbors of
hexagonal close-packed array) is 38''.
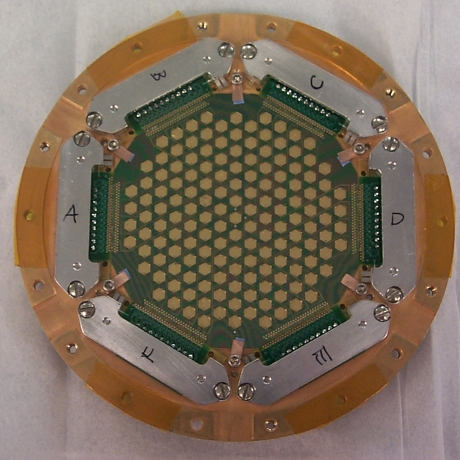
Focal plane close-up. Each empty hexagon is a spider-web bolometer, consisting of a 1 micron-thick silicon nitride mesh etched into the shape of spider-web. The webs are metallized with gold to absorb incident optical power. A neutron-transmutation-doped germanium thermistor (one per web) measures the temperature of the absorbing film, which changes in response to changes in optical power, such as when the telescope scans across an astronomical source.
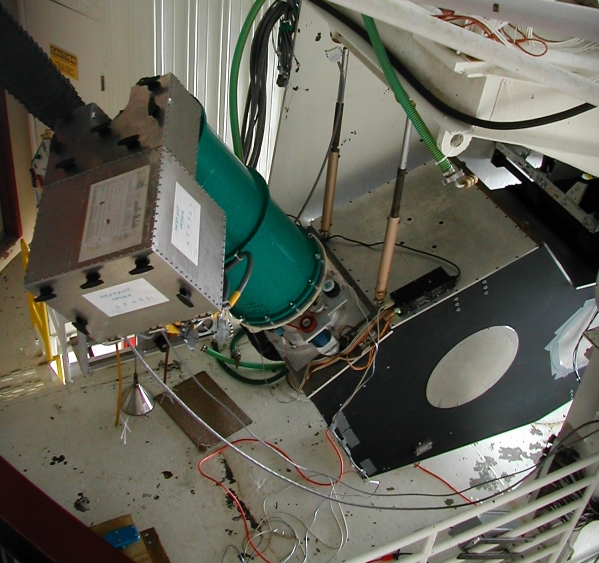
Picture of the Bolocam dewar on optics box at the CSO Cass focus. The blue dewar contains liquid cryogens and a closed-cycle refrigerator to cool the focal plane array to 250 mK. Light from the telescope is focused via mirrors in the large black box into the dewar through a foam window. The metal box contains readout electronics; cables exiting the box carry the focal plane signals to more electronics and a data acquisition computer.
Bolocam has a median mapping speed of approximately 20 arcm2/mJy2/hr (1.1 mm) and 10 arcm2/mJy2/hr (2.1 mm) when aggressive sky subtraction is used (at the cost of imaging of structures larger than 1-2 beam sizes). Less aggressive sky subtraction results in mapping speeds about a factor of 2 worse but preserves extended structure (few arcs). Detailed information on calculating expected observation depth and preparing for observing are provided on the Bolocam web page. Examples of recent Bolocam results are shown below.
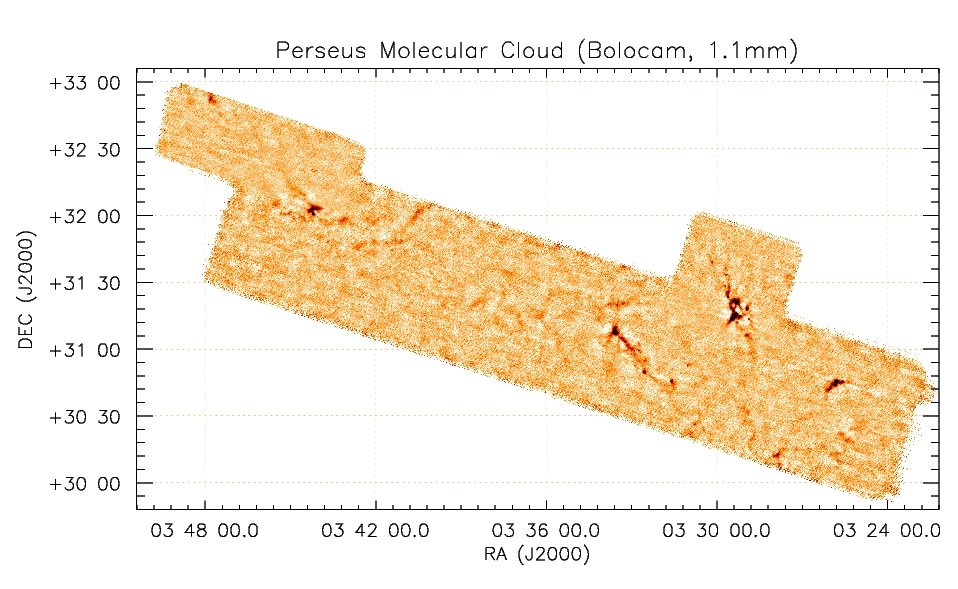 Three nearby large star-forming molecular clouds have been
mapped with Bolocam as part of the
"Cores to Disks" Spitzer Legacy program. The
completed map of Perseus (above; from Enoch et al. 2004) is the largest (sub)mm survey to date of
Perseus, and represents the first unbiased, flux-limited census of millimeter
cores in the cloud. A number of interesting new starless cores and protostars
have been identified, but perhaps the most striking feature of the map is
how empty it is on a large scale. Analysis is underway to understand how star
formation is taking place in isolated regions across the cloud.
Three nearby large star-forming molecular clouds have been
mapped with Bolocam as part of the
"Cores to Disks" Spitzer Legacy program. The
completed map of Perseus (above; from Enoch et al. 2004) is the largest (sub)mm survey to date of
Perseus, and represents the first unbiased, flux-limited census of millimeter
cores in the cloud. A number of interesting new starless cores and protostars
have been identified, but perhaps the most striking feature of the map is
how empty it is on a large scale. Analysis is underway to understand how star
formation is taking place in isolated regions across the cloud.
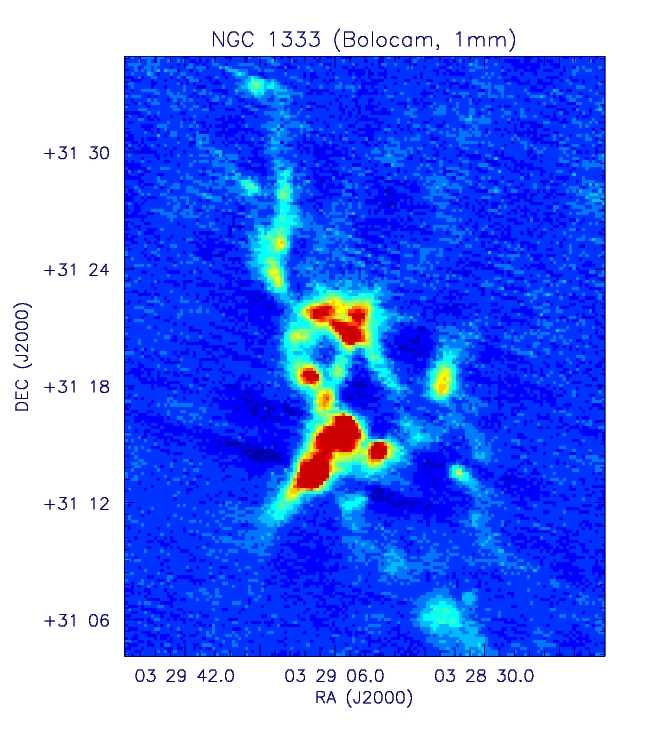
A blow-up of the NCG 1333 region in Perseus (left). All of the previously know
sources in this well studied cluster are seen in the Bolocam map. The 1mm
emission from these sources arises in the envelope of dust and gas surrounding
very young protostellar objects; much of the protostellar flux
is absorbed by the cool dust and emitted at long wavelengths. Because the
dust emission is optically thin, the 1mm flux traces the envelope mass.
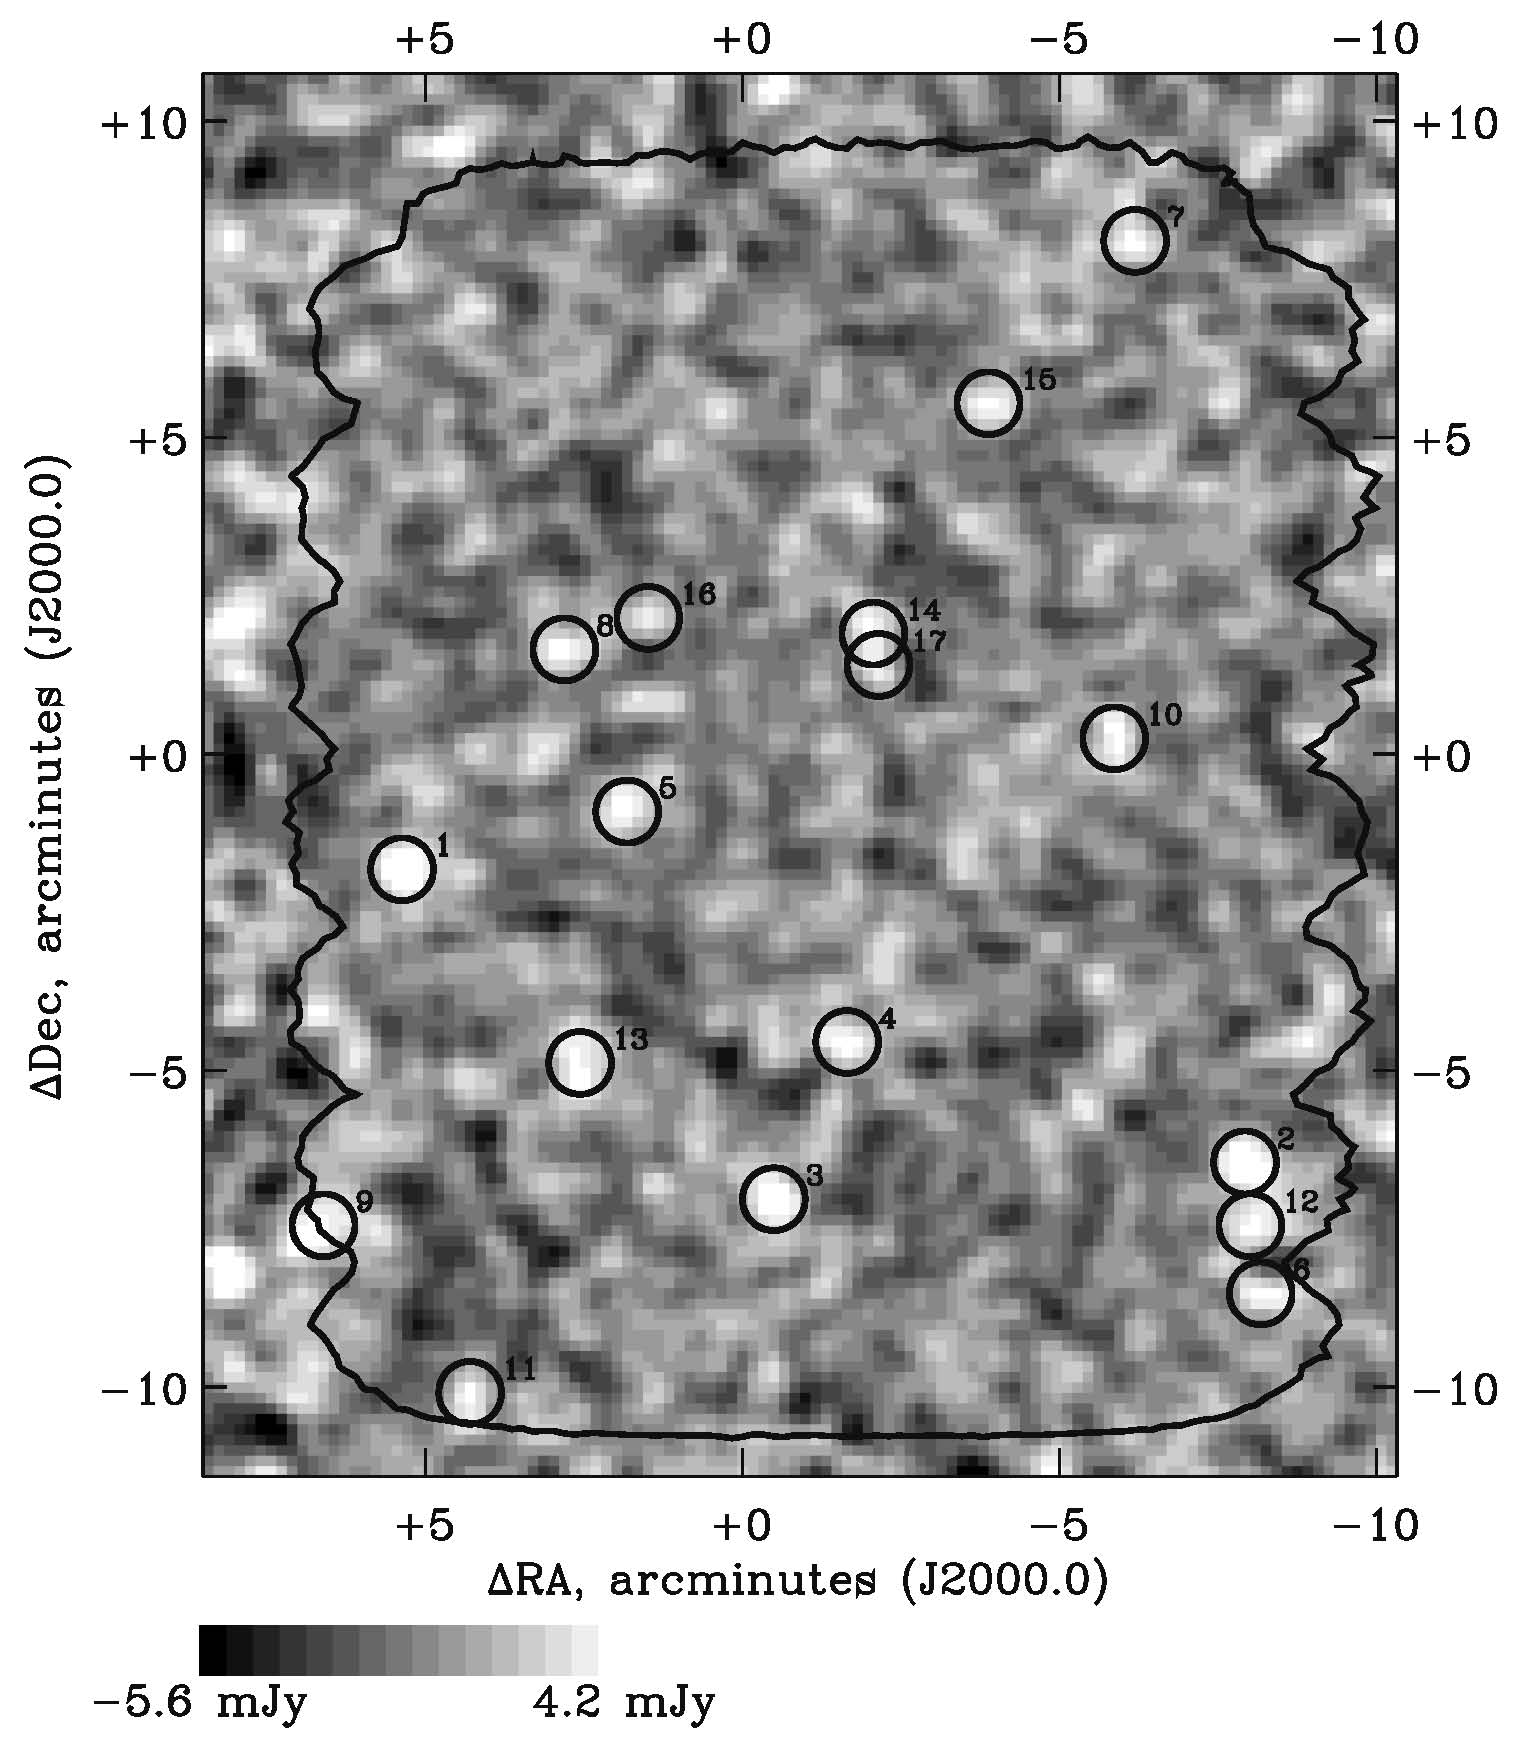
A map of the Lockman Hole East region with Bolocam at 1.1 mm (left). The region of uniform noise coverage (1.4 mJy rms) lies inside the thick black contour, covering an area of 324 square arcminutes. Bolocam's beams are 31" FWHM; circles circumscribe submillimeter galaxy candidates, which are unresolved. The numbers indicate the ordering from brightest to faintest. The pixels are 10" x 10".
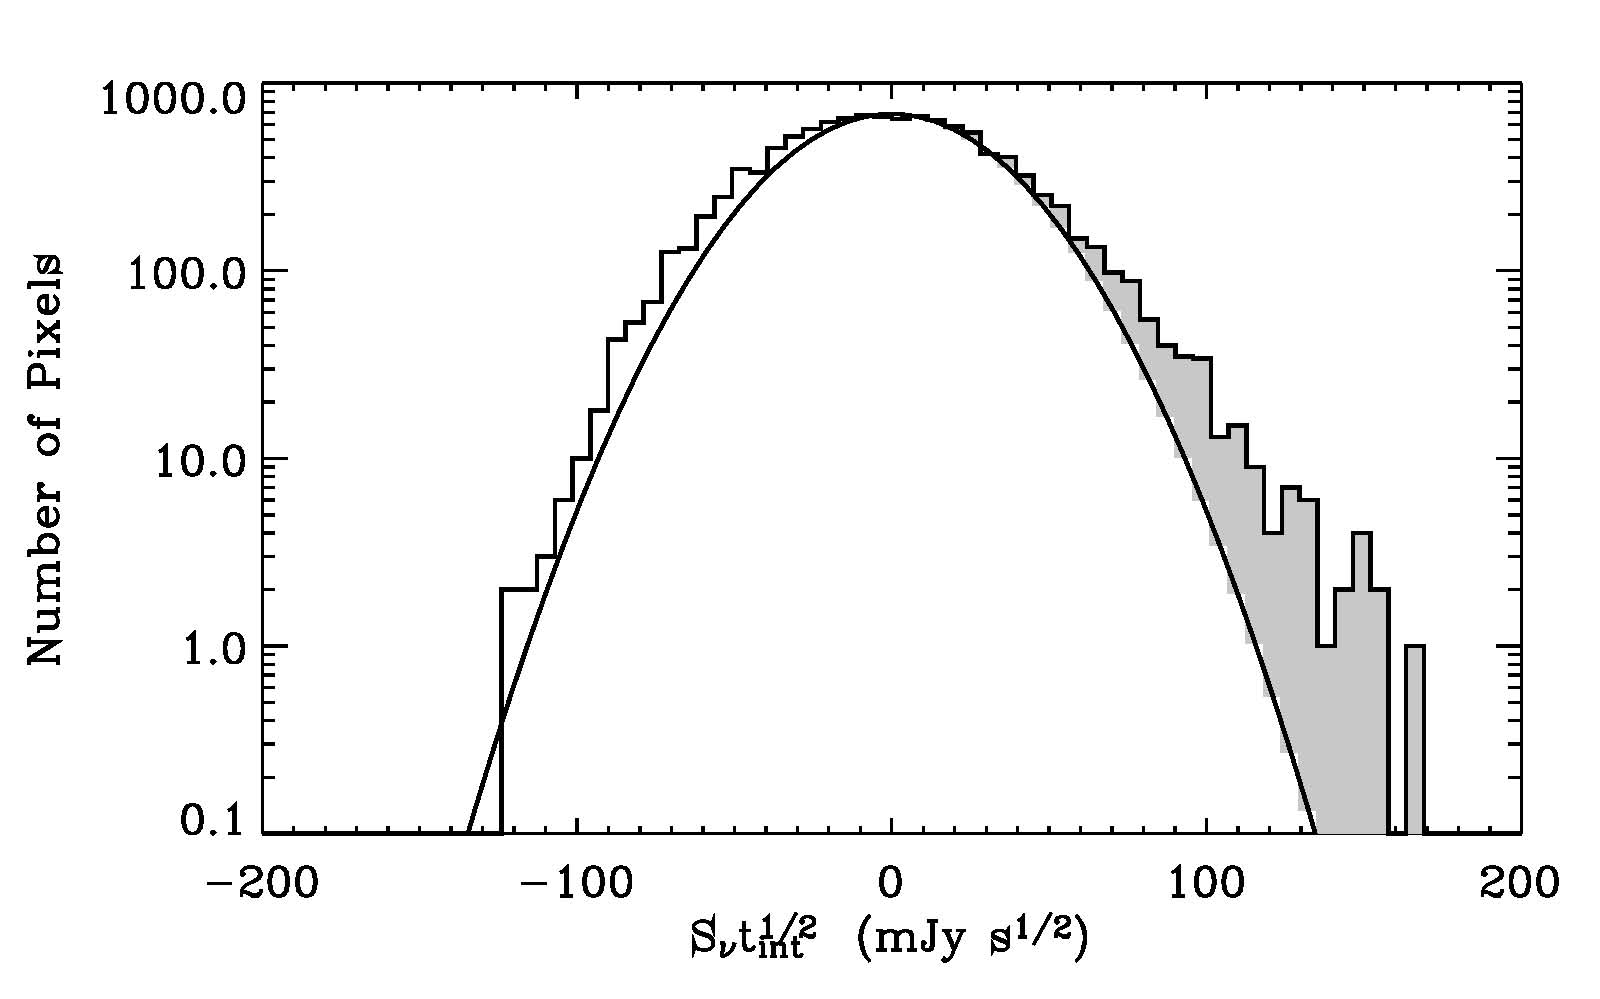 A histogram of the
pixel sensitivities in the Lockman Hole (below). Sensitivivities, in
mJy sqrt(s) are plotted, rather than flux densities, to account for
slight coverage variations across the map resulting in non-uniform
noise. The Gaussian curve is the noise in the map, derived from
jackknife tests. The positive excess (gray) is the signal from the
galaxies. The slight negative excess arises from confusion noise.
A histogram of the
pixel sensitivities in the Lockman Hole (below). Sensitivivities, in
mJy sqrt(s) are plotted, rather than flux densities, to account for
slight coverage variations across the map resulting in non-uniform
noise. The Gaussian curve is the noise in the map, derived from
jackknife tests. The positive excess (gray) is the signal from the
galaxies. The slight negative excess arises from confusion noise.
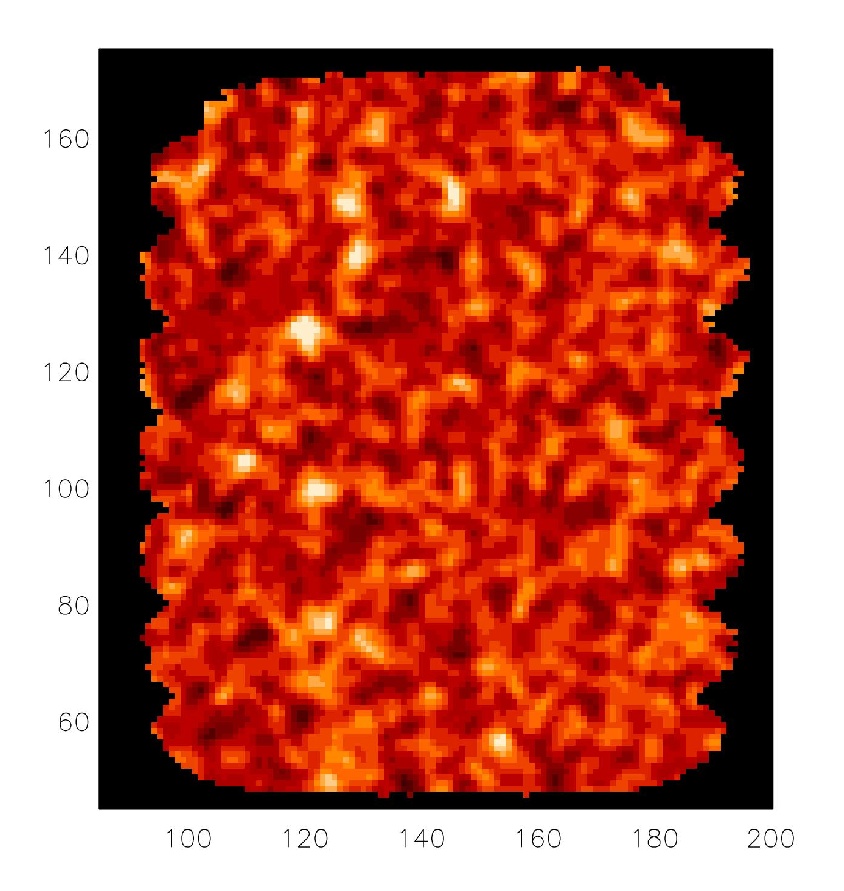
A simulation of the Lockman Hole observations with identical noise characteristics and coverage as the observed Lockman Hole map, and galaxies randomly drawn from a parent population resulting from a P(D) analysis of the observations. The (unresolved) galaxies are evident as bright white sources.
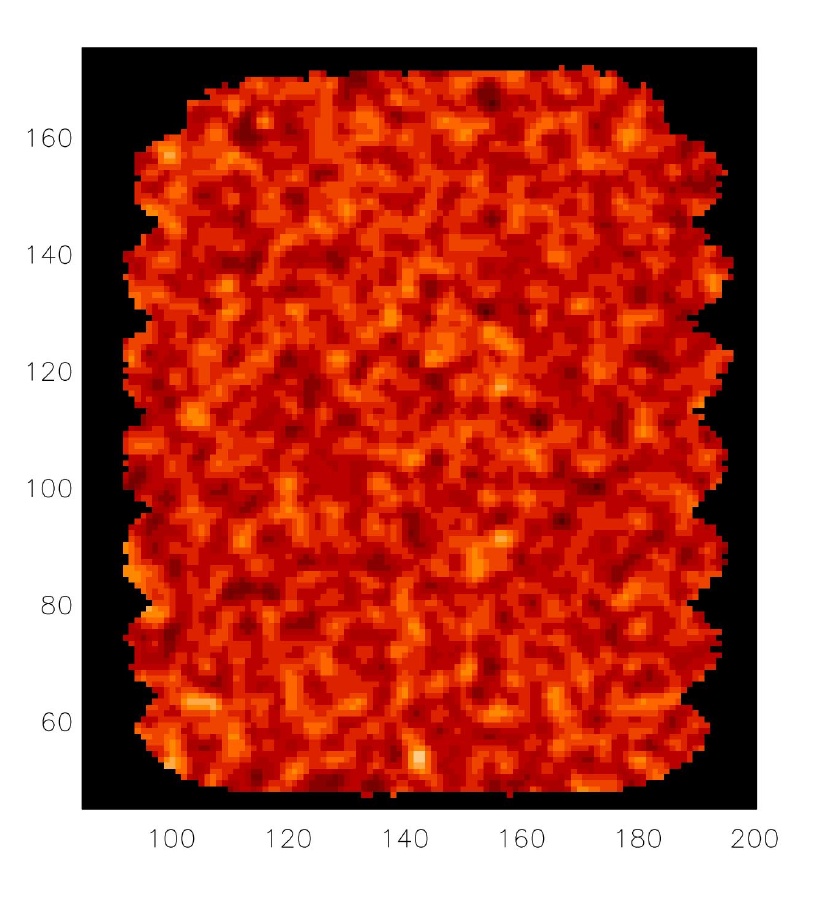
Same as above, but with noise only - no galaxies.
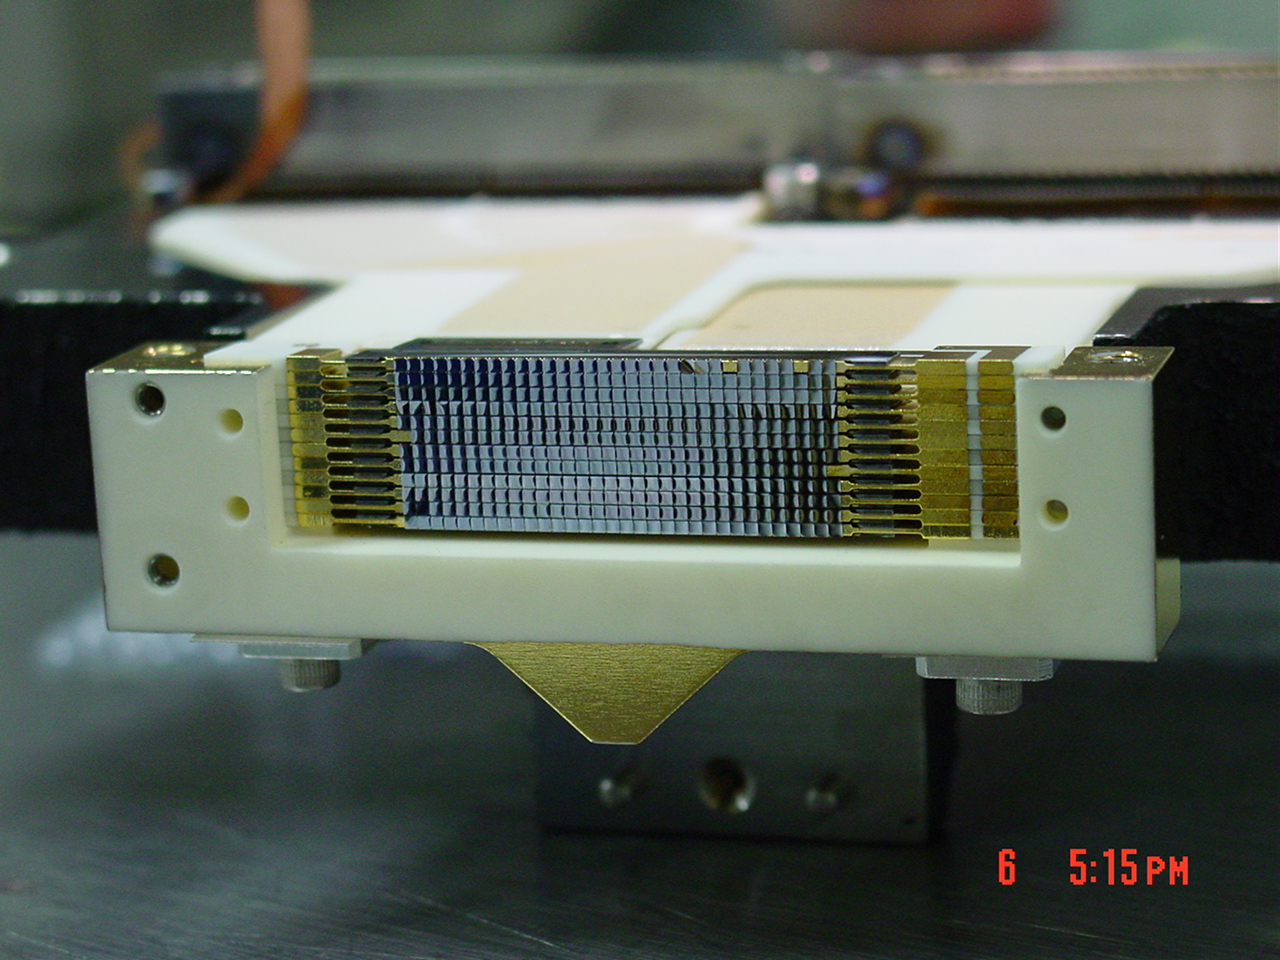
SHARC II Bolometer Camera
SHARC II is a facility 350 µm and 450 µm camera for the CSO, operational since 2002. The key component of SHARC II is a 12 × 32 array of doped silicon `pop-up' bolometers developed at NASA/Goddard (left). In the best 25% of winter nights on Mauna Kea, SHARC II has NEFD at 350 �m of 1 Jy s½ or better. The new camera is 4 times faster at detecting known point sources and 30 times faster at mapping large areas compared to the previous generation instrument. For latest information visit SHARC II Users' Home Page.
SHARC II has been used to address a
variety of topics ranging from imaging of debris disks around nearby stars to
the measurement of luminosities of dusty galaxies at redshifts of z=4 and
beyond. Examples of recent results are shown below.
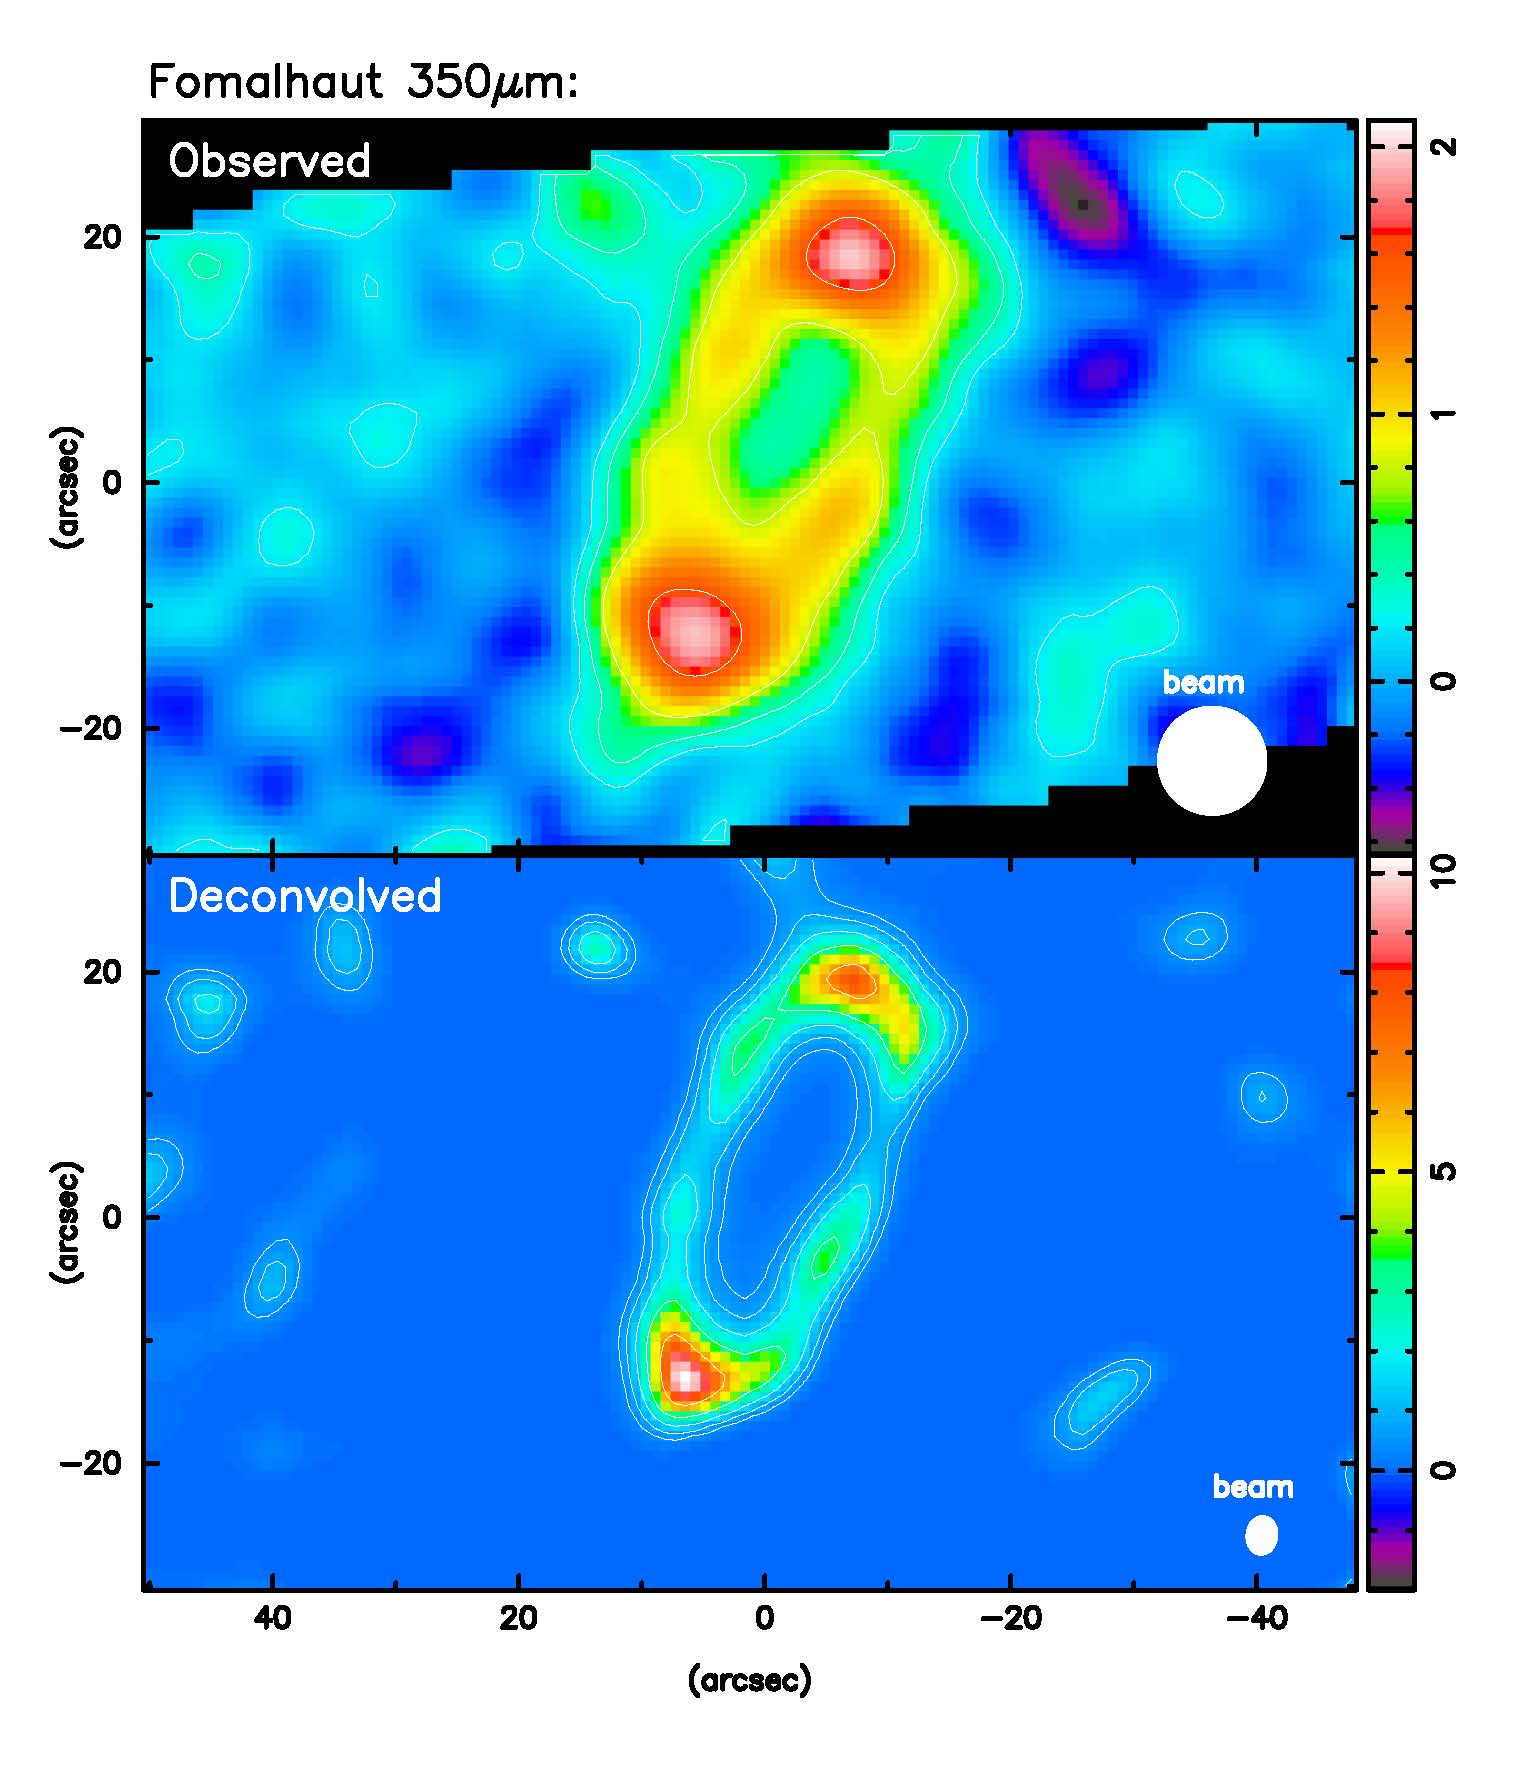
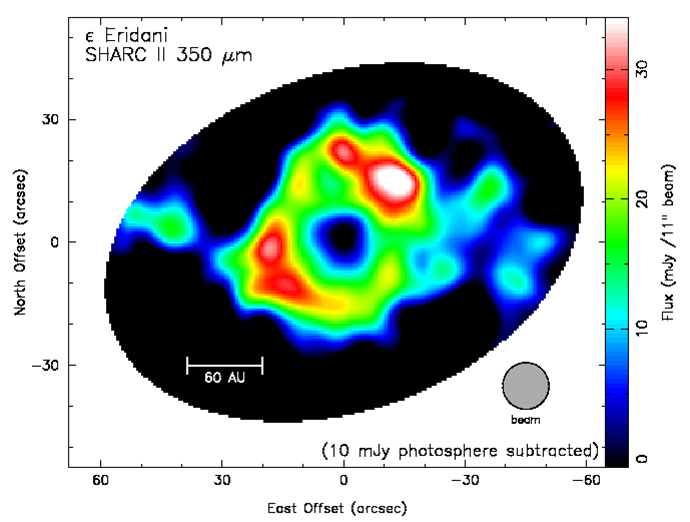
Wilner et al. (2004) and Marsh et al. (2004) imaged the debris disks of two nearby stars with SHARC II, showing for the first time that the material in Fomalhaut resides in a nearly uniform ring (left). The SHARC II image of Epsilon Eridani (below) also shows a ring structure with diameter consistent with the SCUBA 850 �m image (Greaves et al. 1998) and a shallow submillimeter spectrum.
 The SCUBA Local Universe Galaxy Survey (Dunne et al.
2000) determined the 850 �m fluxes of over 100 IRAS selected sources. Of these,
only 17 were detected with SCUBA 450 �m channel, limiting the ability to
constrain in detail the Spectral Energy Distribution of these galaxies. SHARC-II
has detected 60 of the 65 SLUGS sources observed so far, and has obtained high
Signal-to-Noise 350 �m fluxes. Since these short wavelengths probe near the peak
of the thermal emission, the observations are sensitive probes of the Infrared
Luminosity and dust temperature. Above we show 4 objects drawn from the sample.
The background optical images are taken from the DSS survey, and the thick black
outlines denote the area covered by SHARC-II. White SNR contours at intervals of
2,4,6, and 8 are overlaid. Note the diversity of the source properties. In some
cases the submm luminosity is clearly associated with only one member of a
merging pair, while in some it is strongest in the core of a galaxy.
The SCUBA Local Universe Galaxy Survey (Dunne et al.
2000) determined the 850 �m fluxes of over 100 IRAS selected sources. Of these,
only 17 were detected with SCUBA 450 �m channel, limiting the ability to
constrain in detail the Spectral Energy Distribution of these galaxies. SHARC-II
has detected 60 of the 65 SLUGS sources observed so far, and has obtained high
Signal-to-Noise 350 �m fluxes. Since these short wavelengths probe near the peak
of the thermal emission, the observations are sensitive probes of the Infrared
Luminosity and dust temperature. Above we show 4 objects drawn from the sample.
The background optical images are taken from the DSS survey, and the thick black
outlines denote the area covered by SHARC-II. White SNR contours at intervals of
2,4,6, and 8 are overlaid. Note the diversity of the source properties. In some
cases the submm luminosity is clearly associated with only one member of a
merging pair, while in some it is strongest in the core of a galaxy.
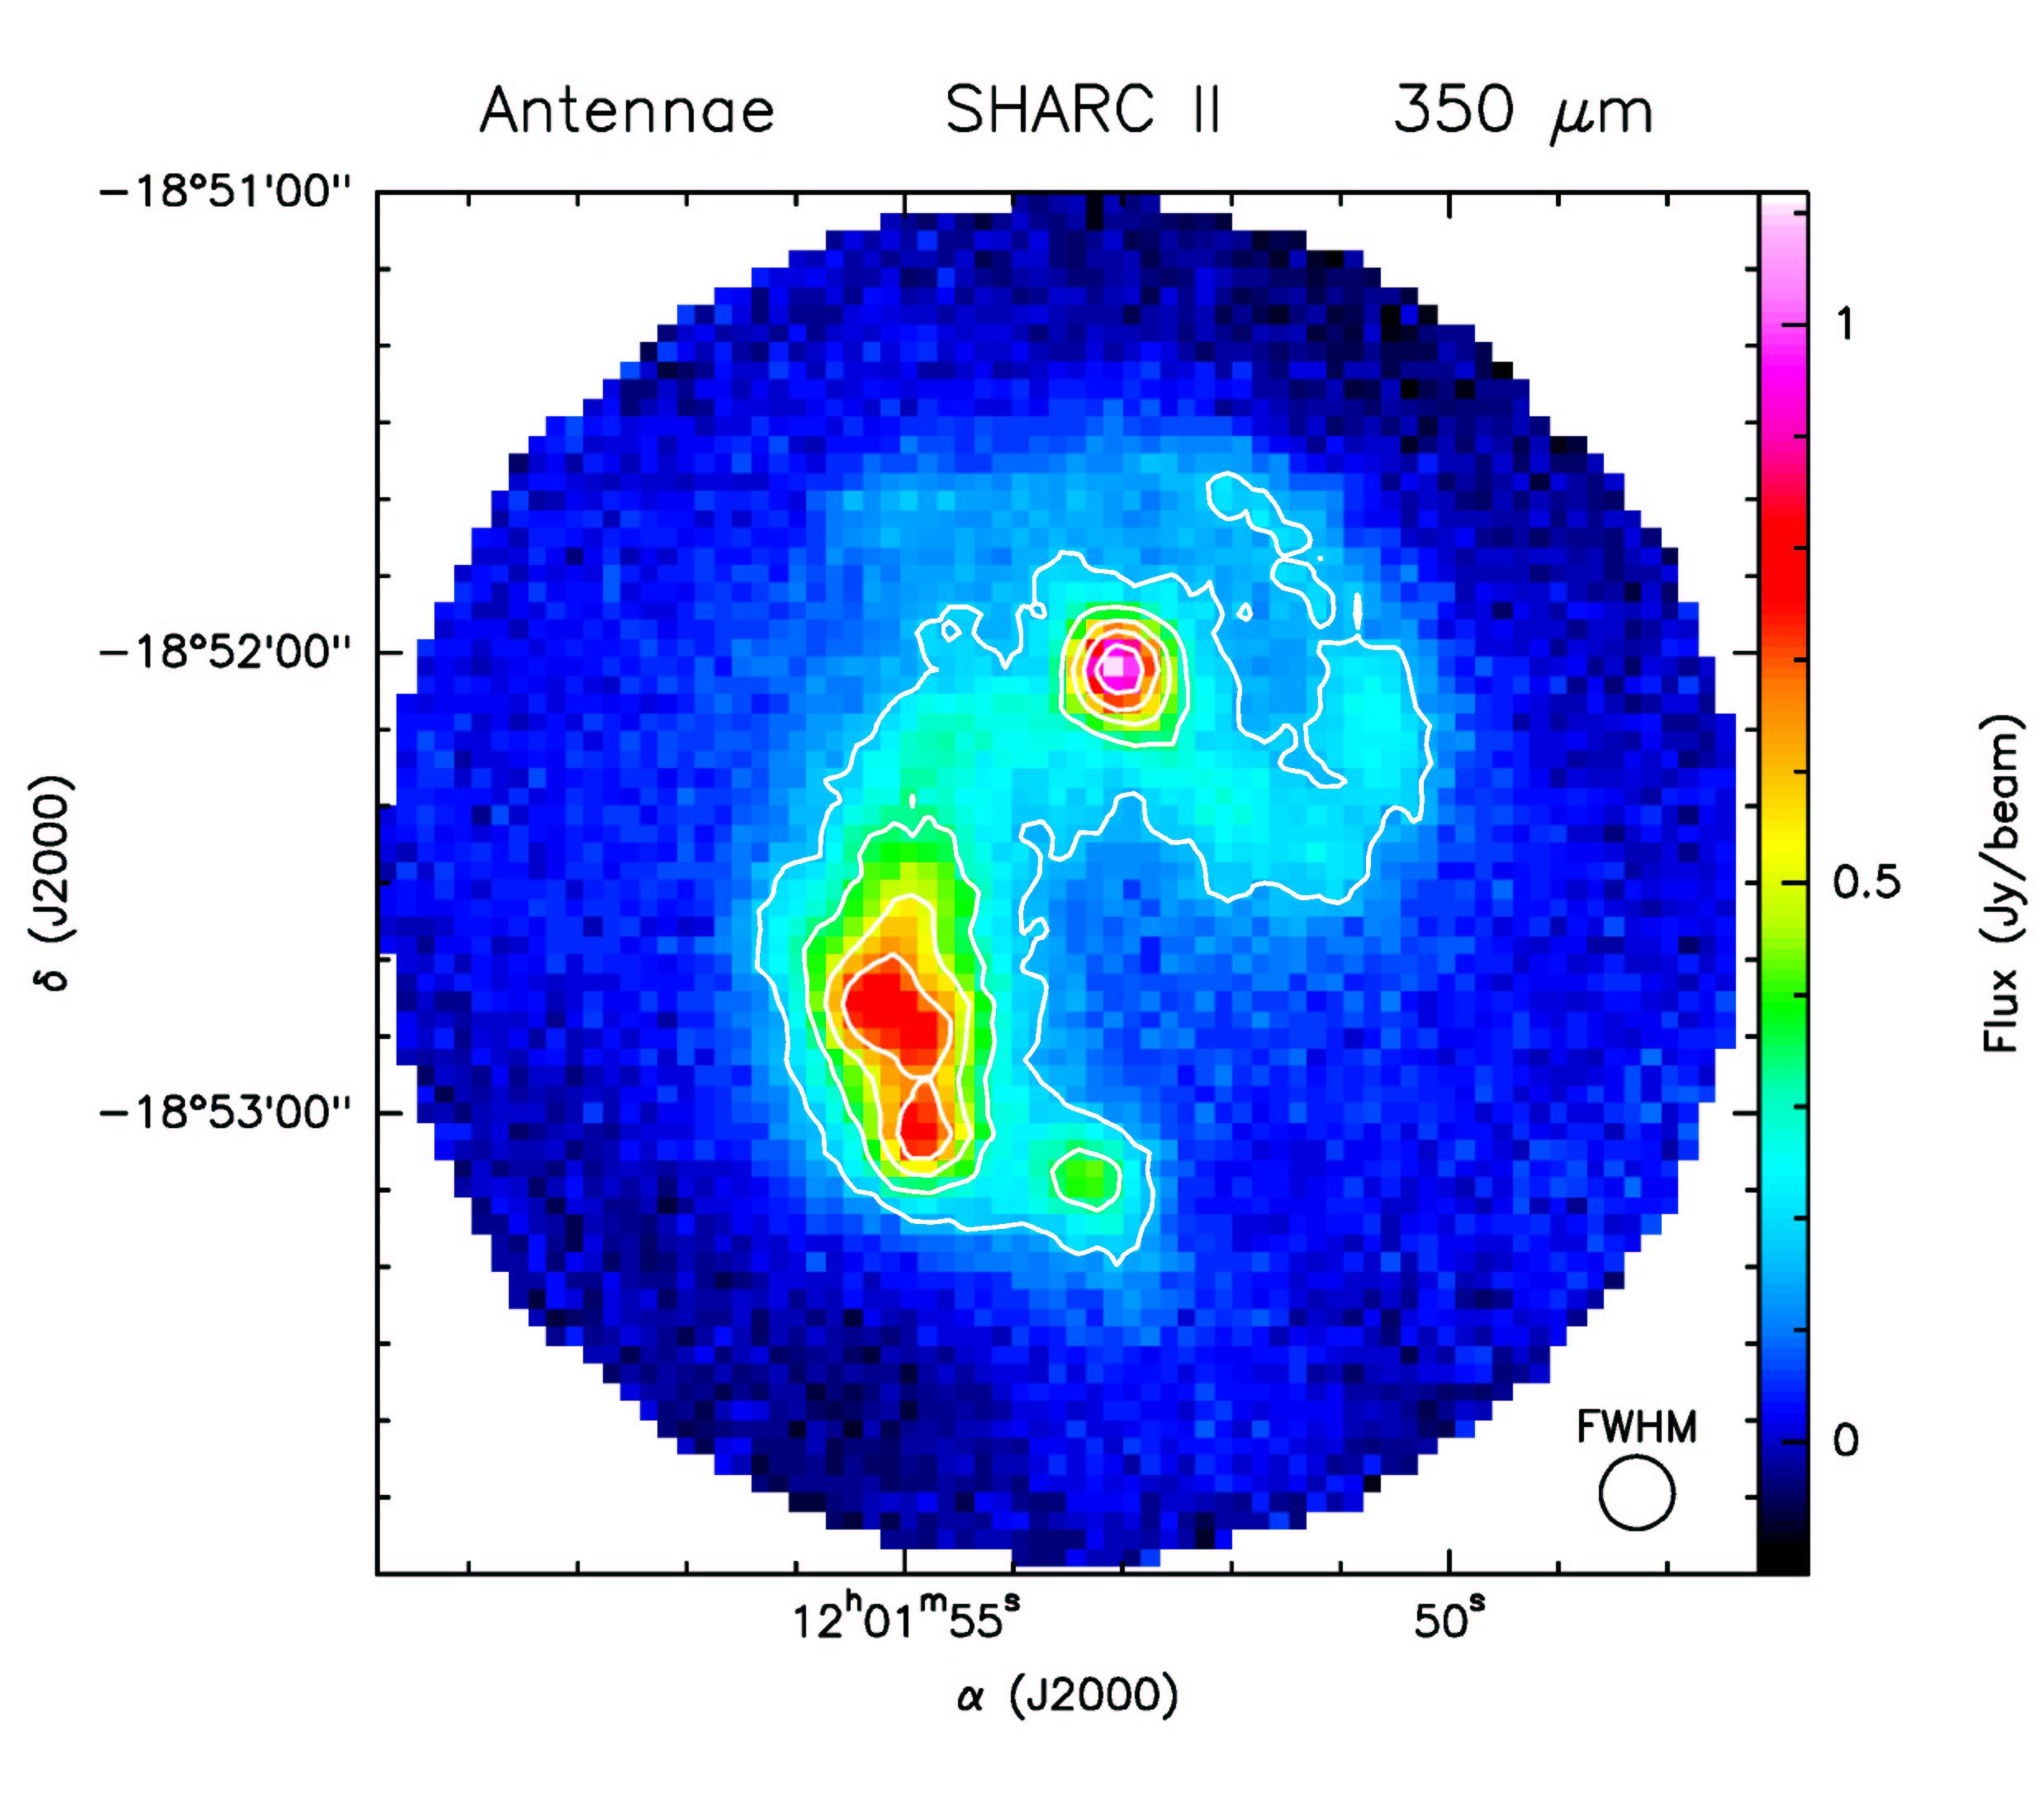
The angular resolution and field of view of SHARC II
are well suited to making resolved images of IR galaxies and mergers at 10-100
Mpc, such as the Antennae.
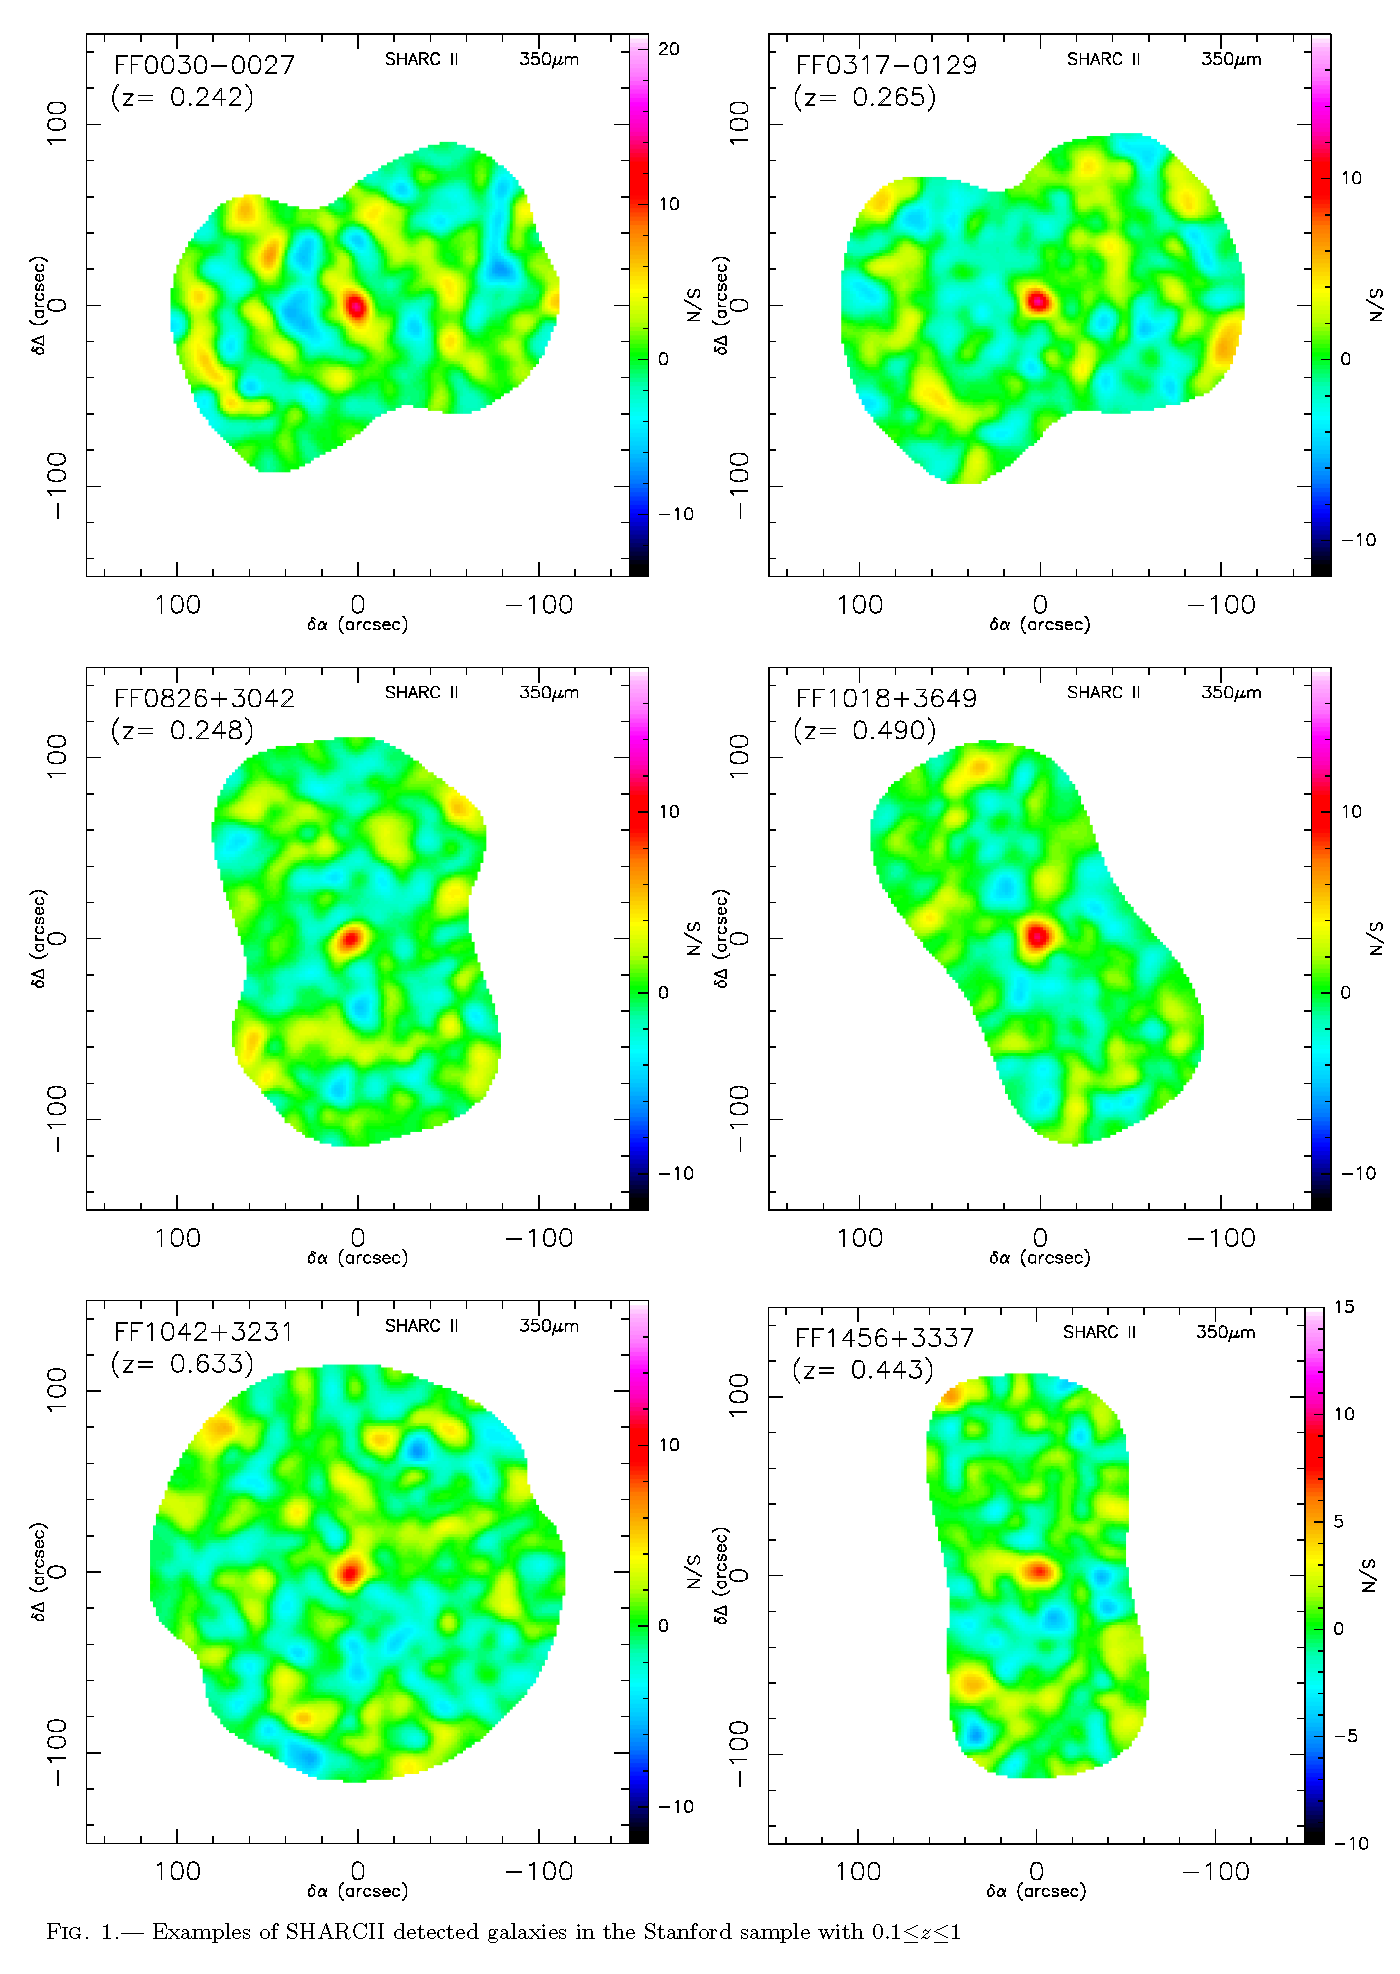
Sharc II images of selected galaxies from the Stanford
sample; PhD thesis work by Min Yang at Caltech.
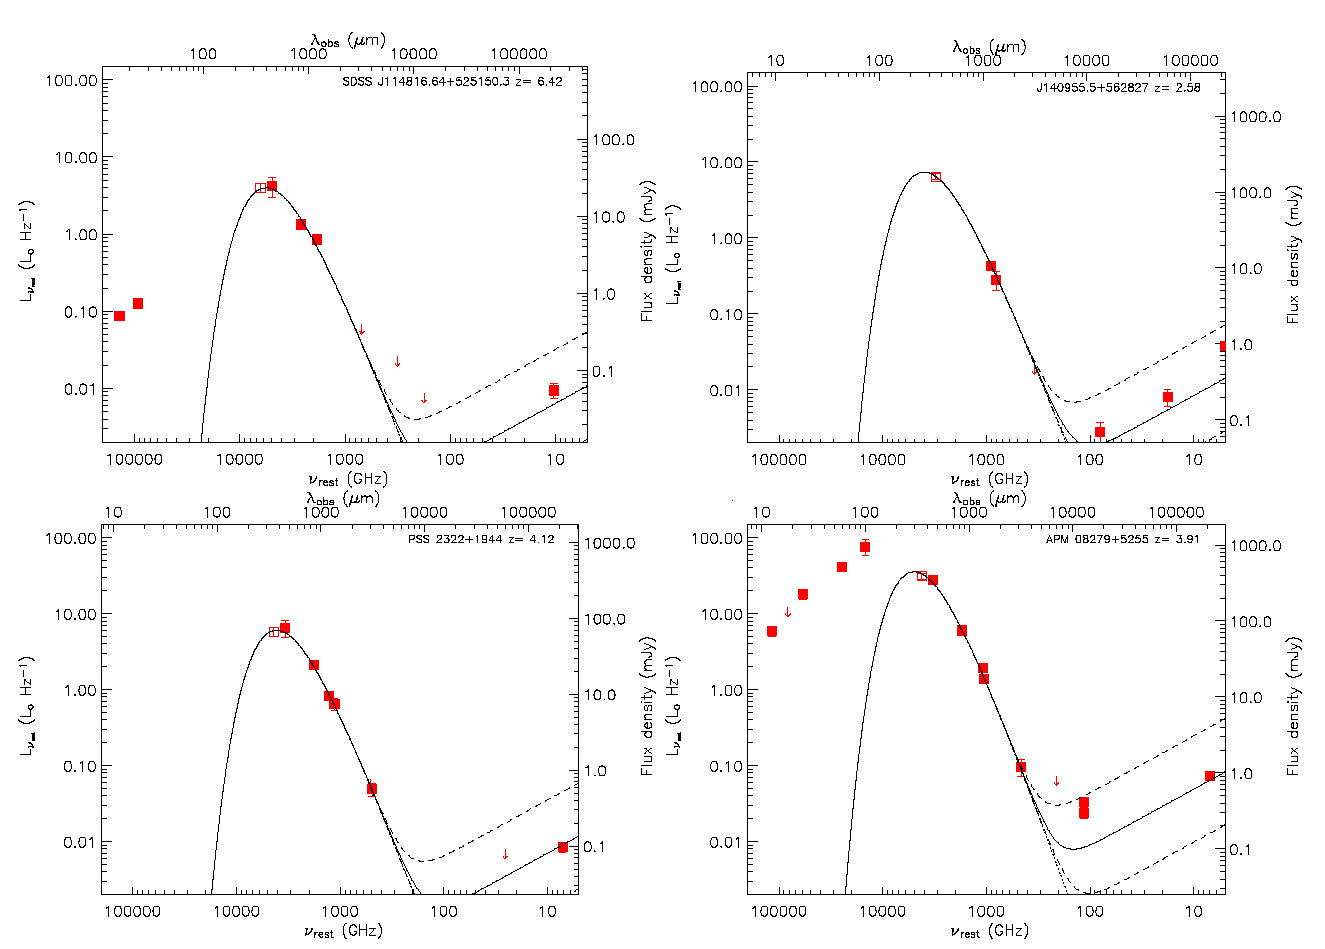 Beelen et al. (2004) recently detected the 350 �m emission
from six z = 2-6 quasars with median flux of 70 mJy. Since 350 um probes the
rest-frame peak of the dust spectrum of a redshift ~3 galaxy, it provides an
important constraint on dust temperature and far-infrared luminosity. In the
figure below, the open squares show the new SHARC II results.
Beelen et al. (2004) recently detected the 350 �m emission
from six z = 2-6 quasars with median flux of 70 mJy. Since 350 um probes the
rest-frame peak of the dust spectrum of a redshift ~3 galaxy, it provides an
important constraint on dust temperature and far-infrared luminosity. In the
figure below, the open squares show the new SHARC II results.
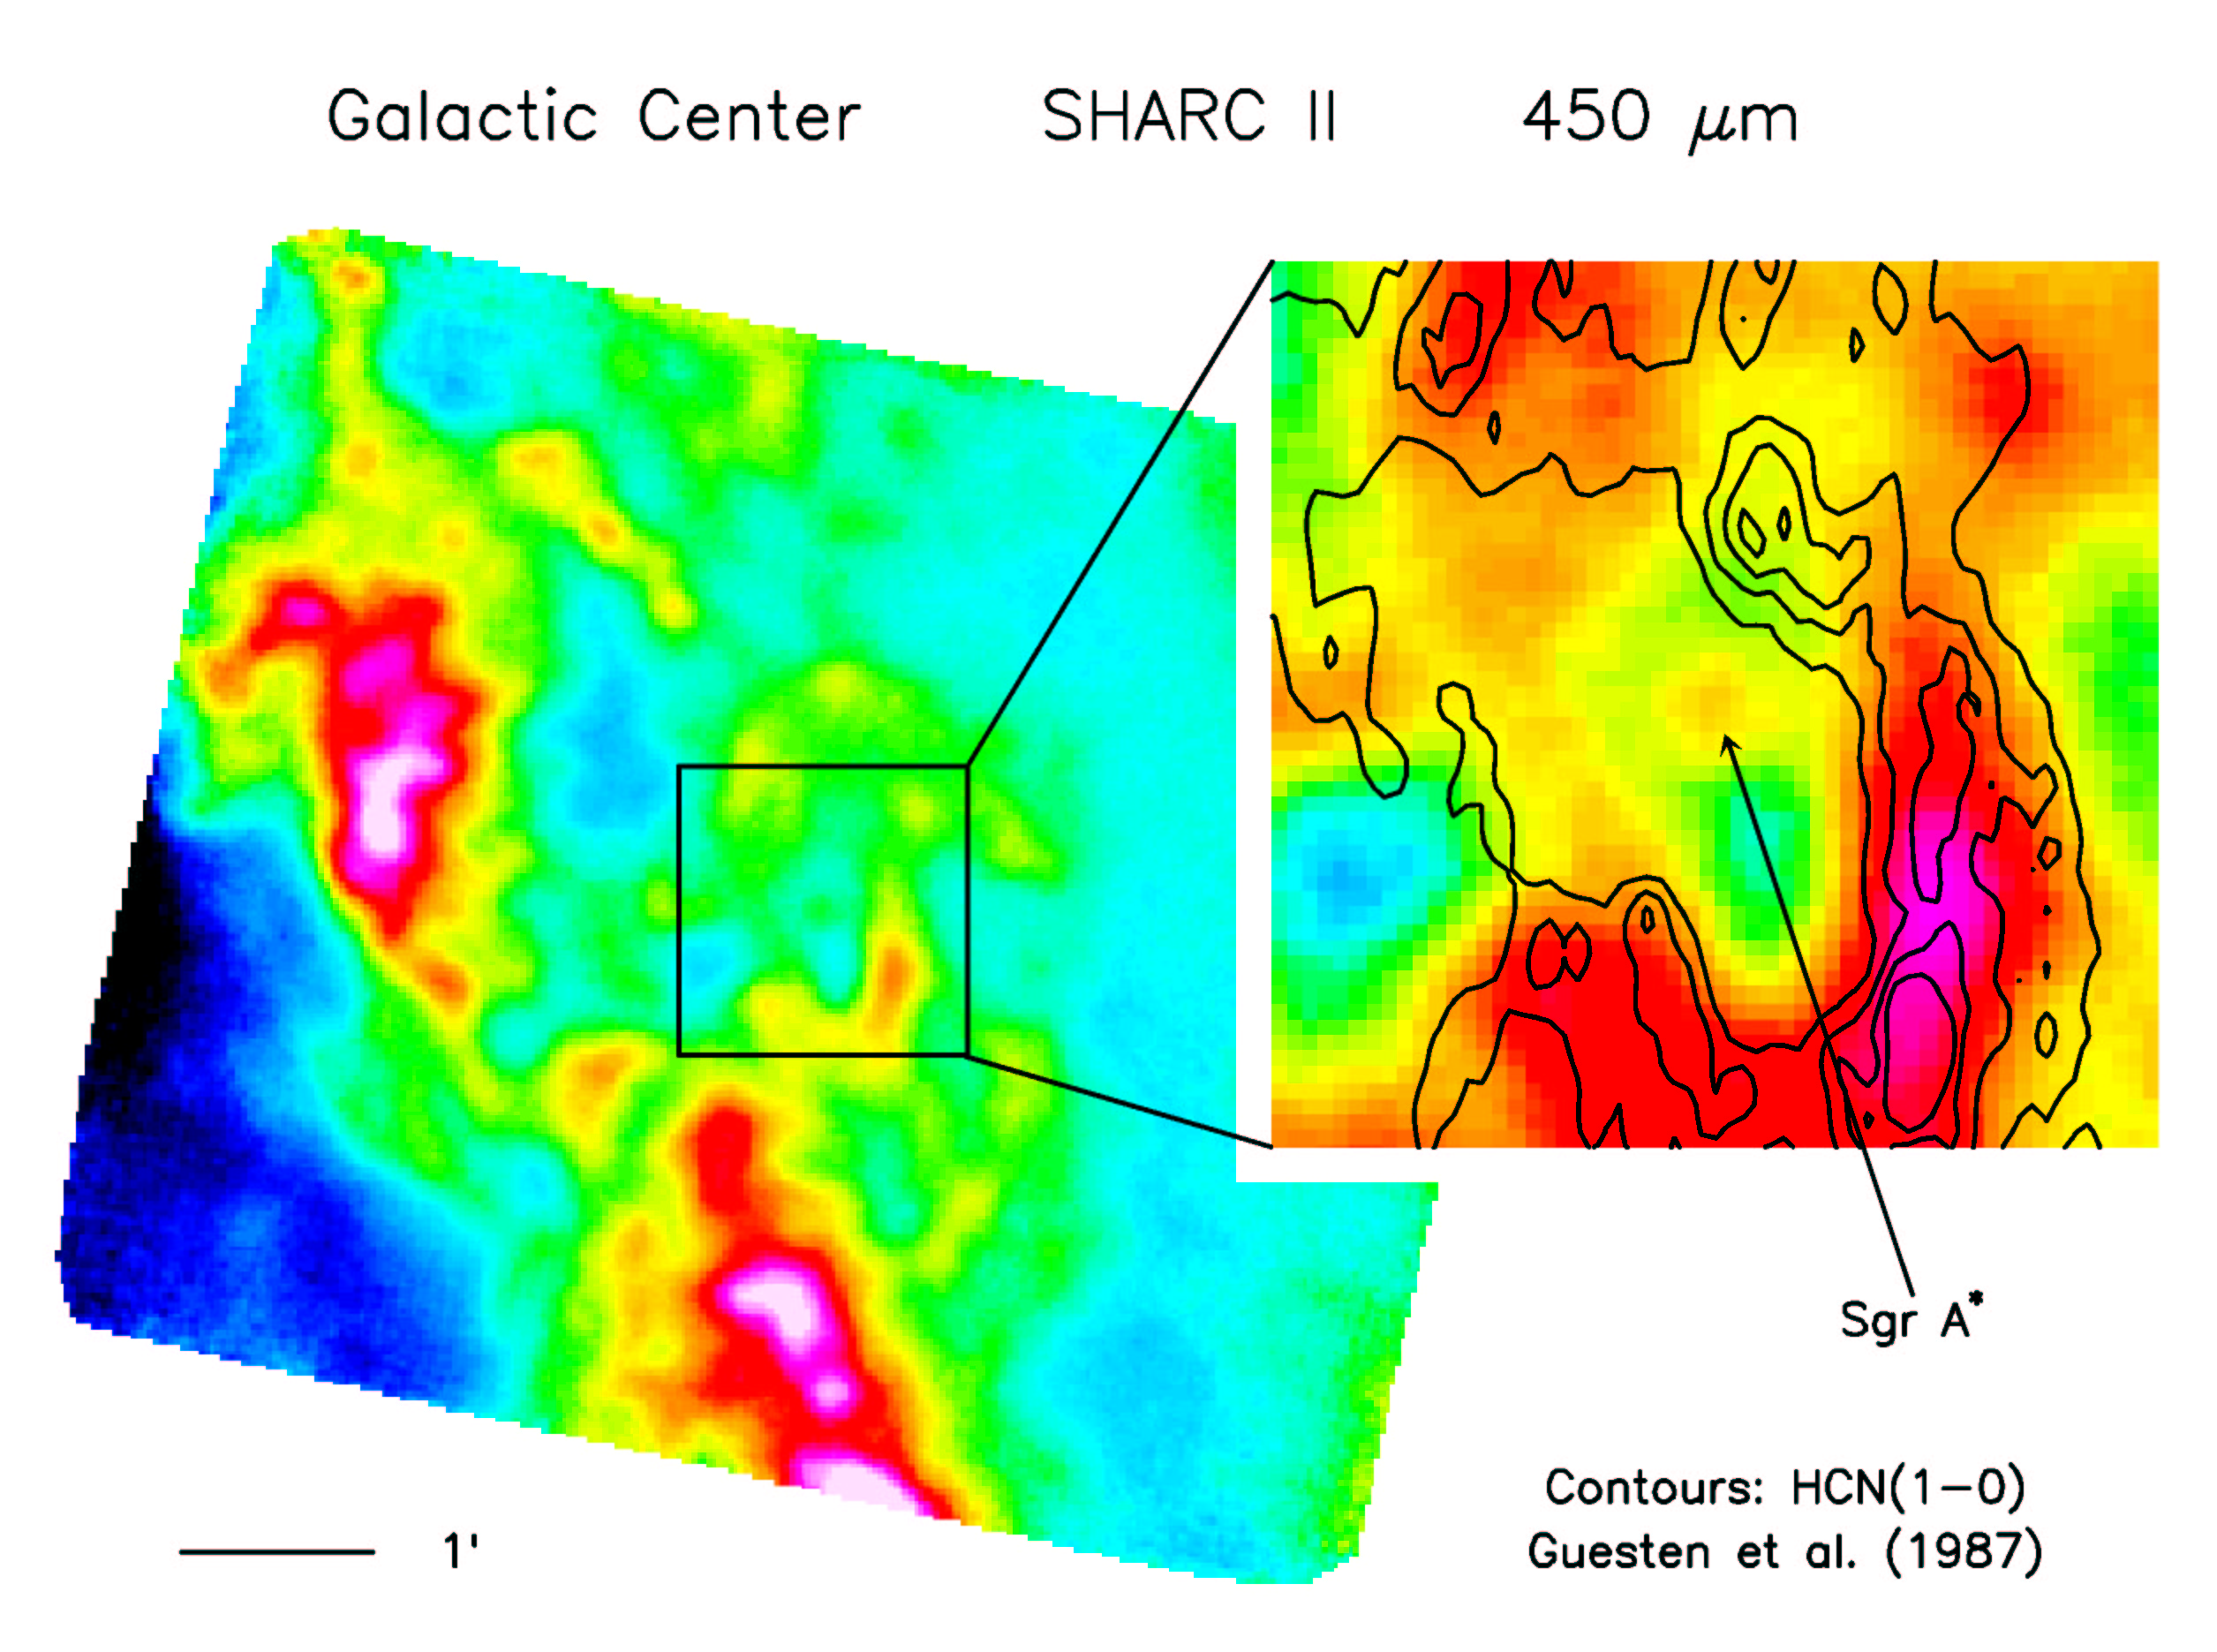
The CSO/SHARC II provided 350, 450, and
850 �m photometry to multi-national, multi-wavelength observing campaigns on Sgr
A* in April and September 2004.
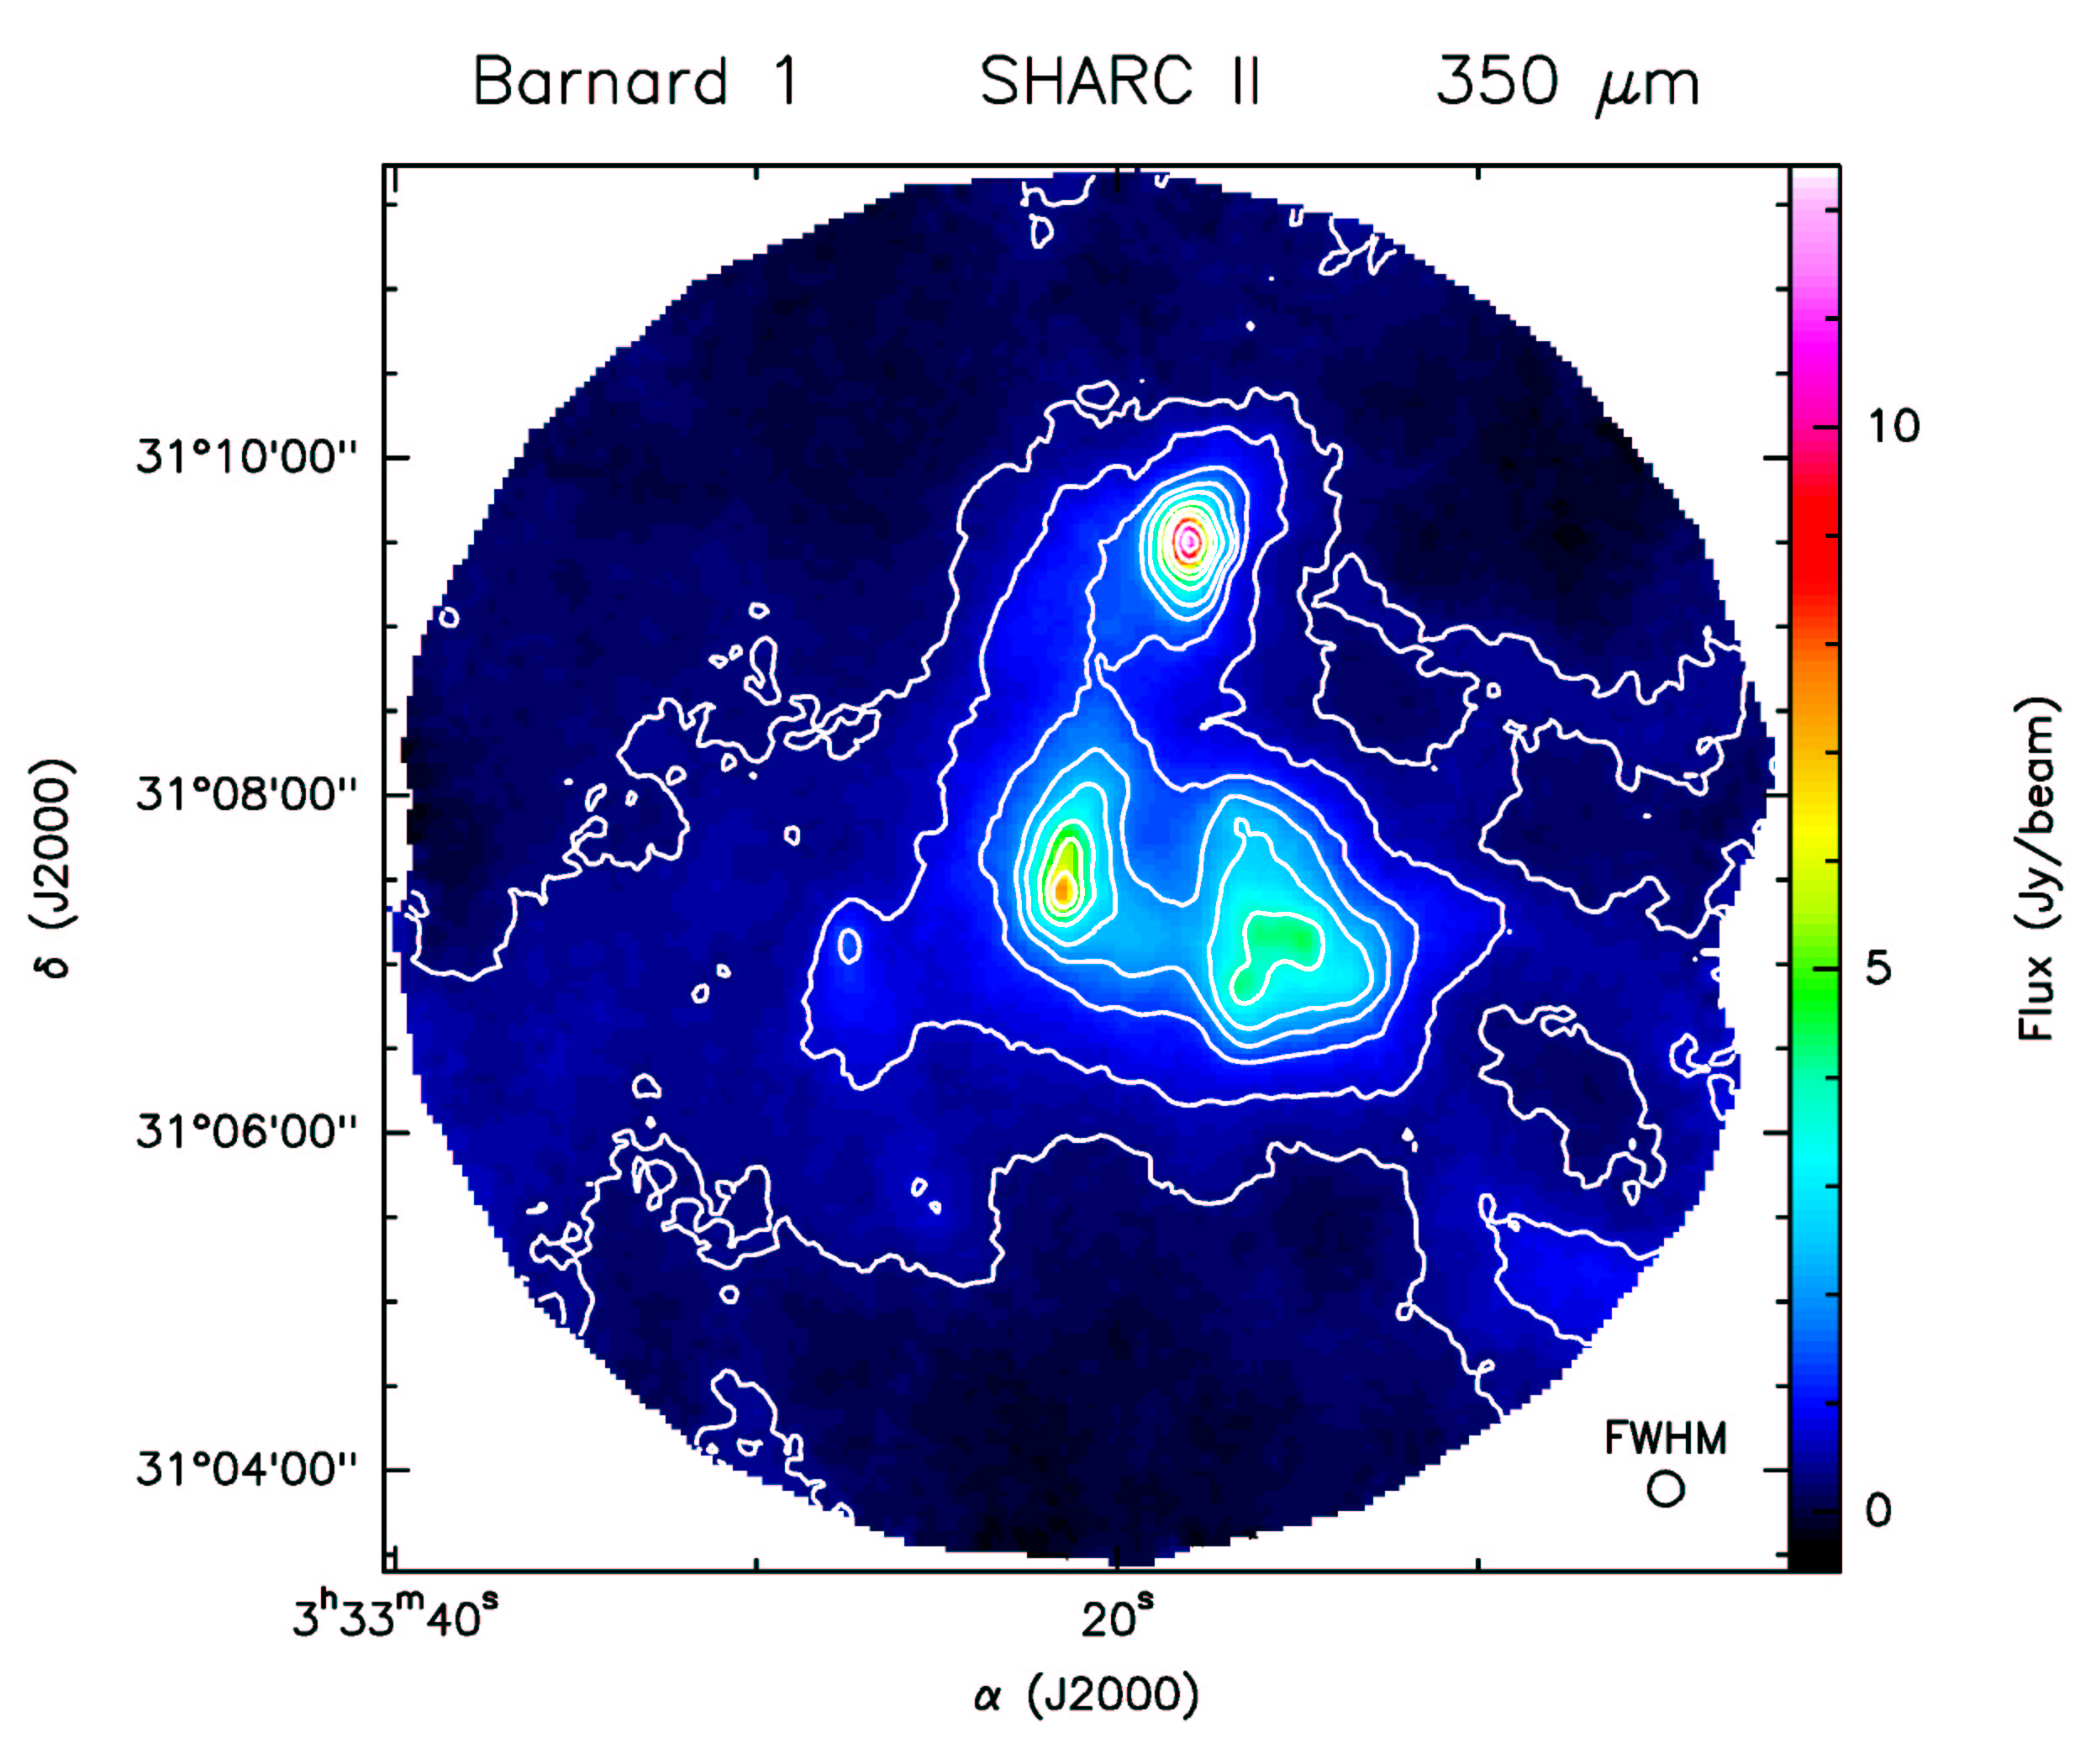
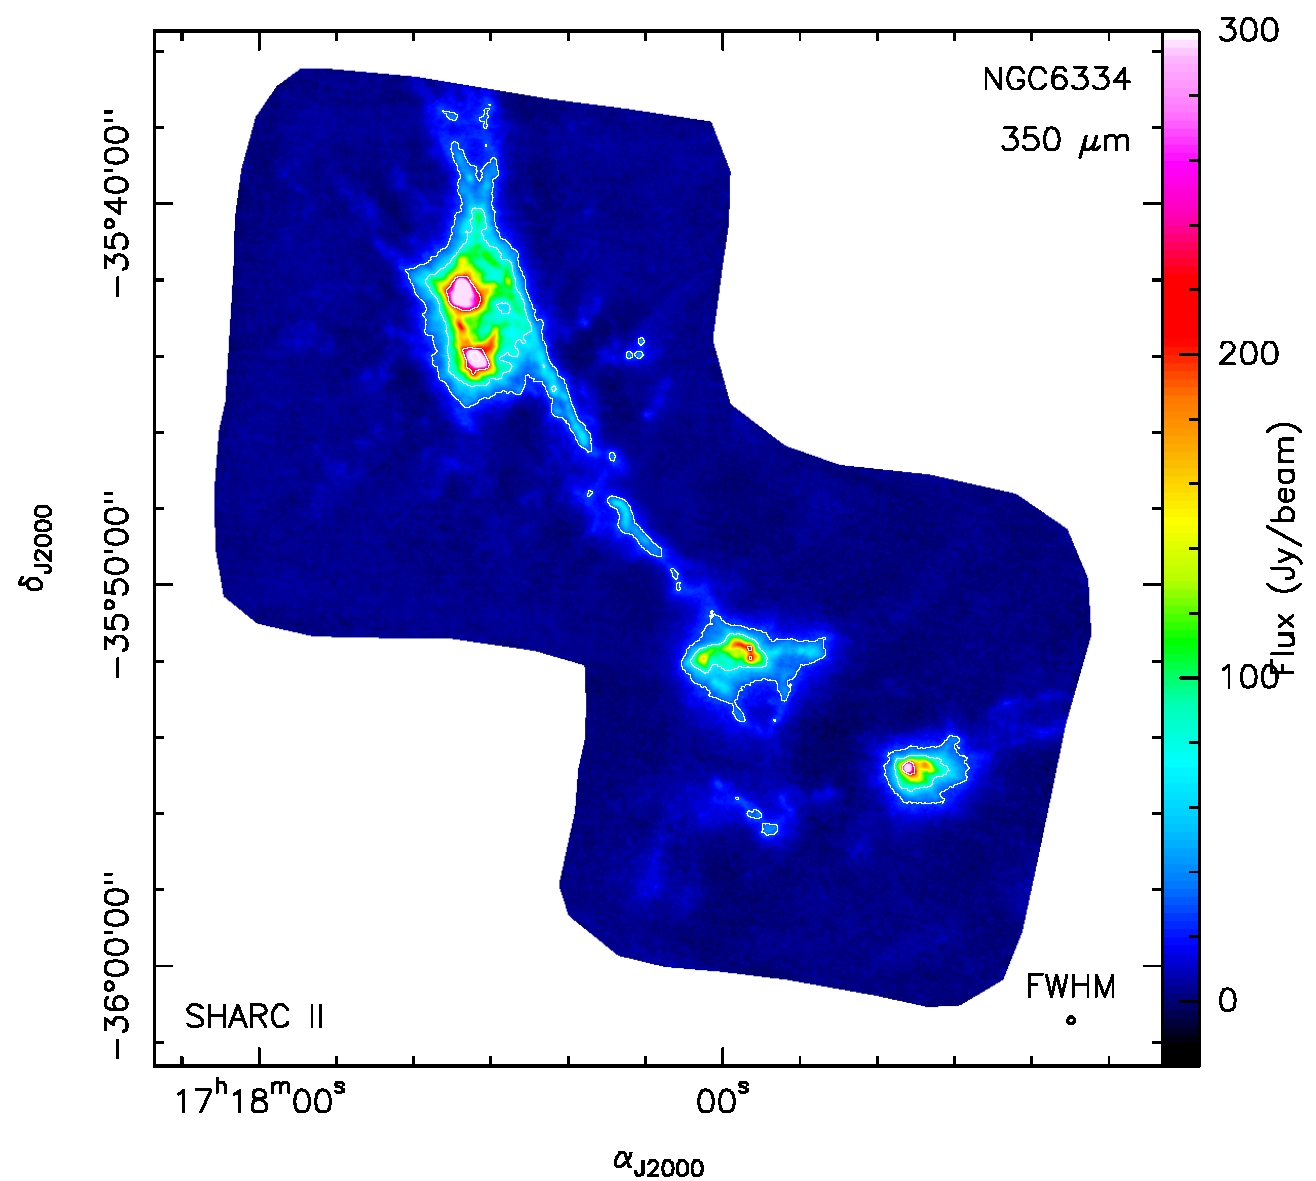
A number of galactic star forming regions have been imaged with SHARC II at 350 �m. Example images of Barnard 1 and NGC 6334 are shown below.
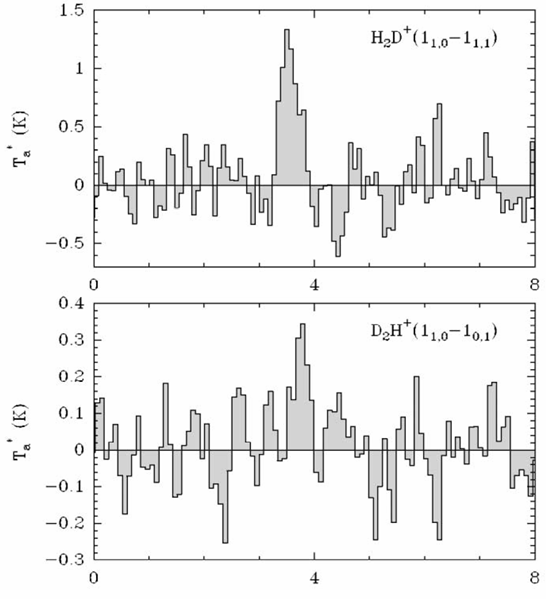
H2D+ and D2H+
spectra in Lynda 1689N observed with the CSO (Vastel et al. 2004).
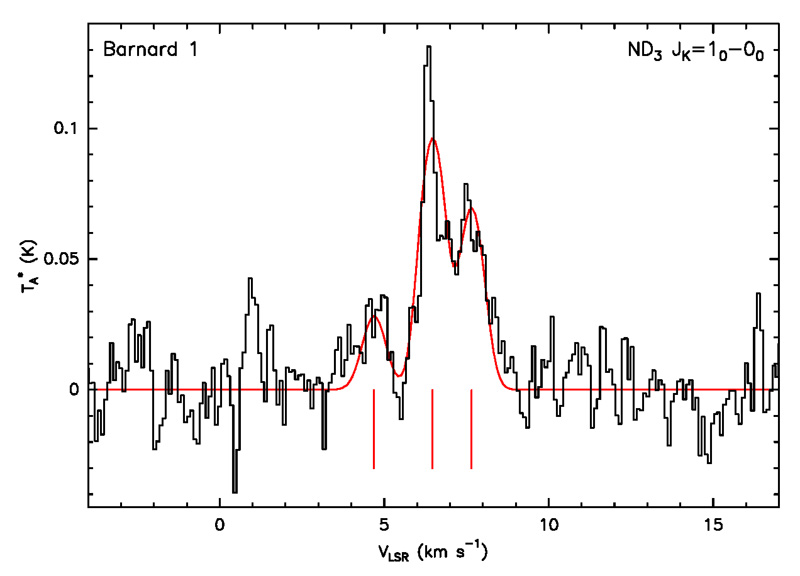 ND3,
the first triply deuterated molecule detected in the ISM, has symmetry and energy levels similar to those of NH3. The ground state rotational transition is split into two components by inversion. Each inversion component is further split into a closely spaced triplet by the 14N quadrupole coupling. ND3 was, surprisingly, fairly easily detected at the CSO in two sources: Barnard 1 (Lis et al. 2002) and NGC 1333 (van der Tak et al. 2002).
ND3,
the first triply deuterated molecule detected in the ISM, has symmetry and energy levels similar to those of NH3. The ground state rotational transition is split into two components by inversion. Each inversion component is further split into a closely spaced triplet by the 14N quadrupole coupling. ND3 was, surprisingly, fairly easily detected at the CSO in two sources: Barnard 1 (Lis et al. 2002) and NGC 1333 (van der Tak et al. 2002).
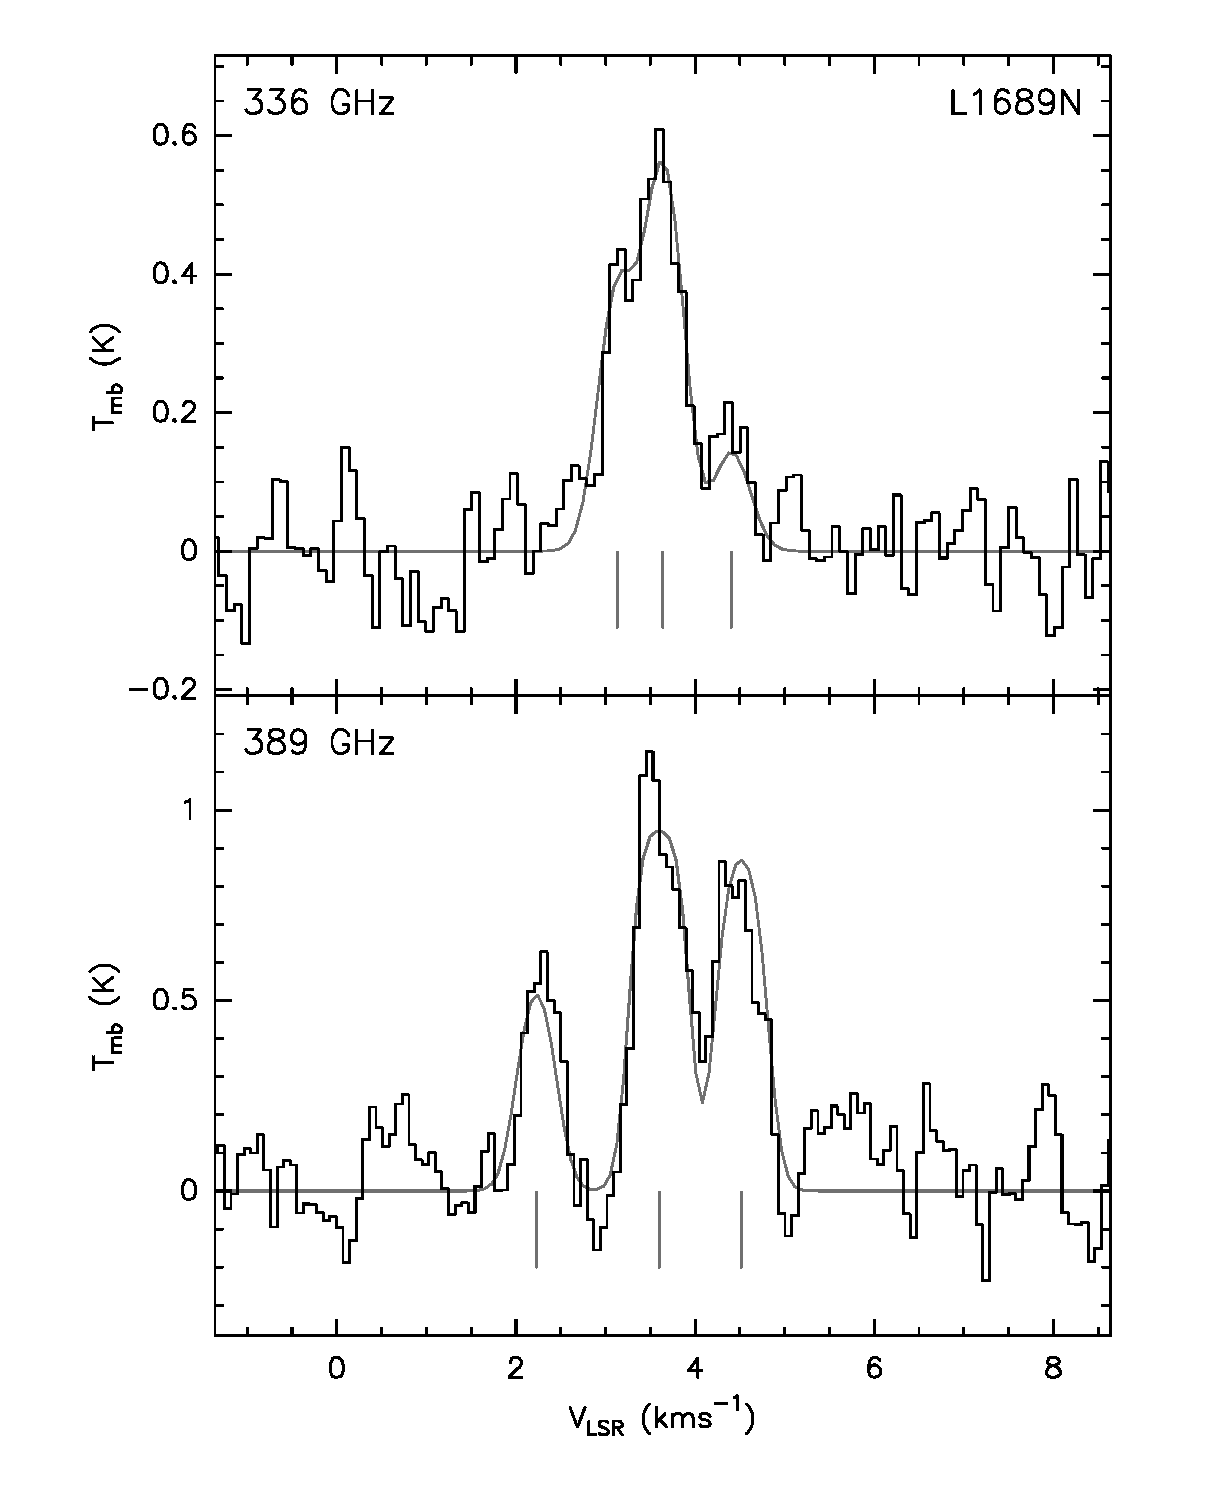 The
ground state rotational lines of o-ND2H at 335.5 and 388.7 GHz, were
recently detected at the CSO in L1689N and B1 (Lis et al 2005). The hyperfine
splitting allows the determination of the line opacity and the excitation
temperature. The p-ND2H at 335.4 GHz was also detected in both
sources allowing the measurement of the ortho-to-para ratio. The two o-ND2H
transitions have different spontaneous emission rate coefficients and therefore
critical densities. With the help of proper modeling tools, they can provide
good constraints on the excitation conditions in dense, cold gas. On good sites,
such as Mauna Kea, the submillimeter ND2H lines are easier to detect
than the 3 mm lines previously used to study the distribution and abundance of
this molecule in the interstellar medium. Interferometric observations of the
submillimeter ND2H lines with SMA, and subsequently ALMA, will
provide new opportunities to image the inner structure of cold, dense cores,
where most molecules are heavily depleted onto dust grains.
The
ground state rotational lines of o-ND2H at 335.5 and 388.7 GHz, were
recently detected at the CSO in L1689N and B1 (Lis et al 2005). The hyperfine
splitting allows the determination of the line opacity and the excitation
temperature. The p-ND2H at 335.4 GHz was also detected in both
sources allowing the measurement of the ortho-to-para ratio. The two o-ND2H
transitions have different spontaneous emission rate coefficients and therefore
critical densities. With the help of proper modeling tools, they can provide
good constraints on the excitation conditions in dense, cold gas. On good sites,
such as Mauna Kea, the submillimeter ND2H lines are easier to detect
than the 3 mm lines previously used to study the distribution and abundance of
this molecule in the interstellar medium. Interferometric observations of the
submillimeter ND2H lines with SMA, and subsequently ALMA, will
provide new opportunities to image the inner structure of cold, dense cores,
where most molecules are heavily depleted onto dust grains.
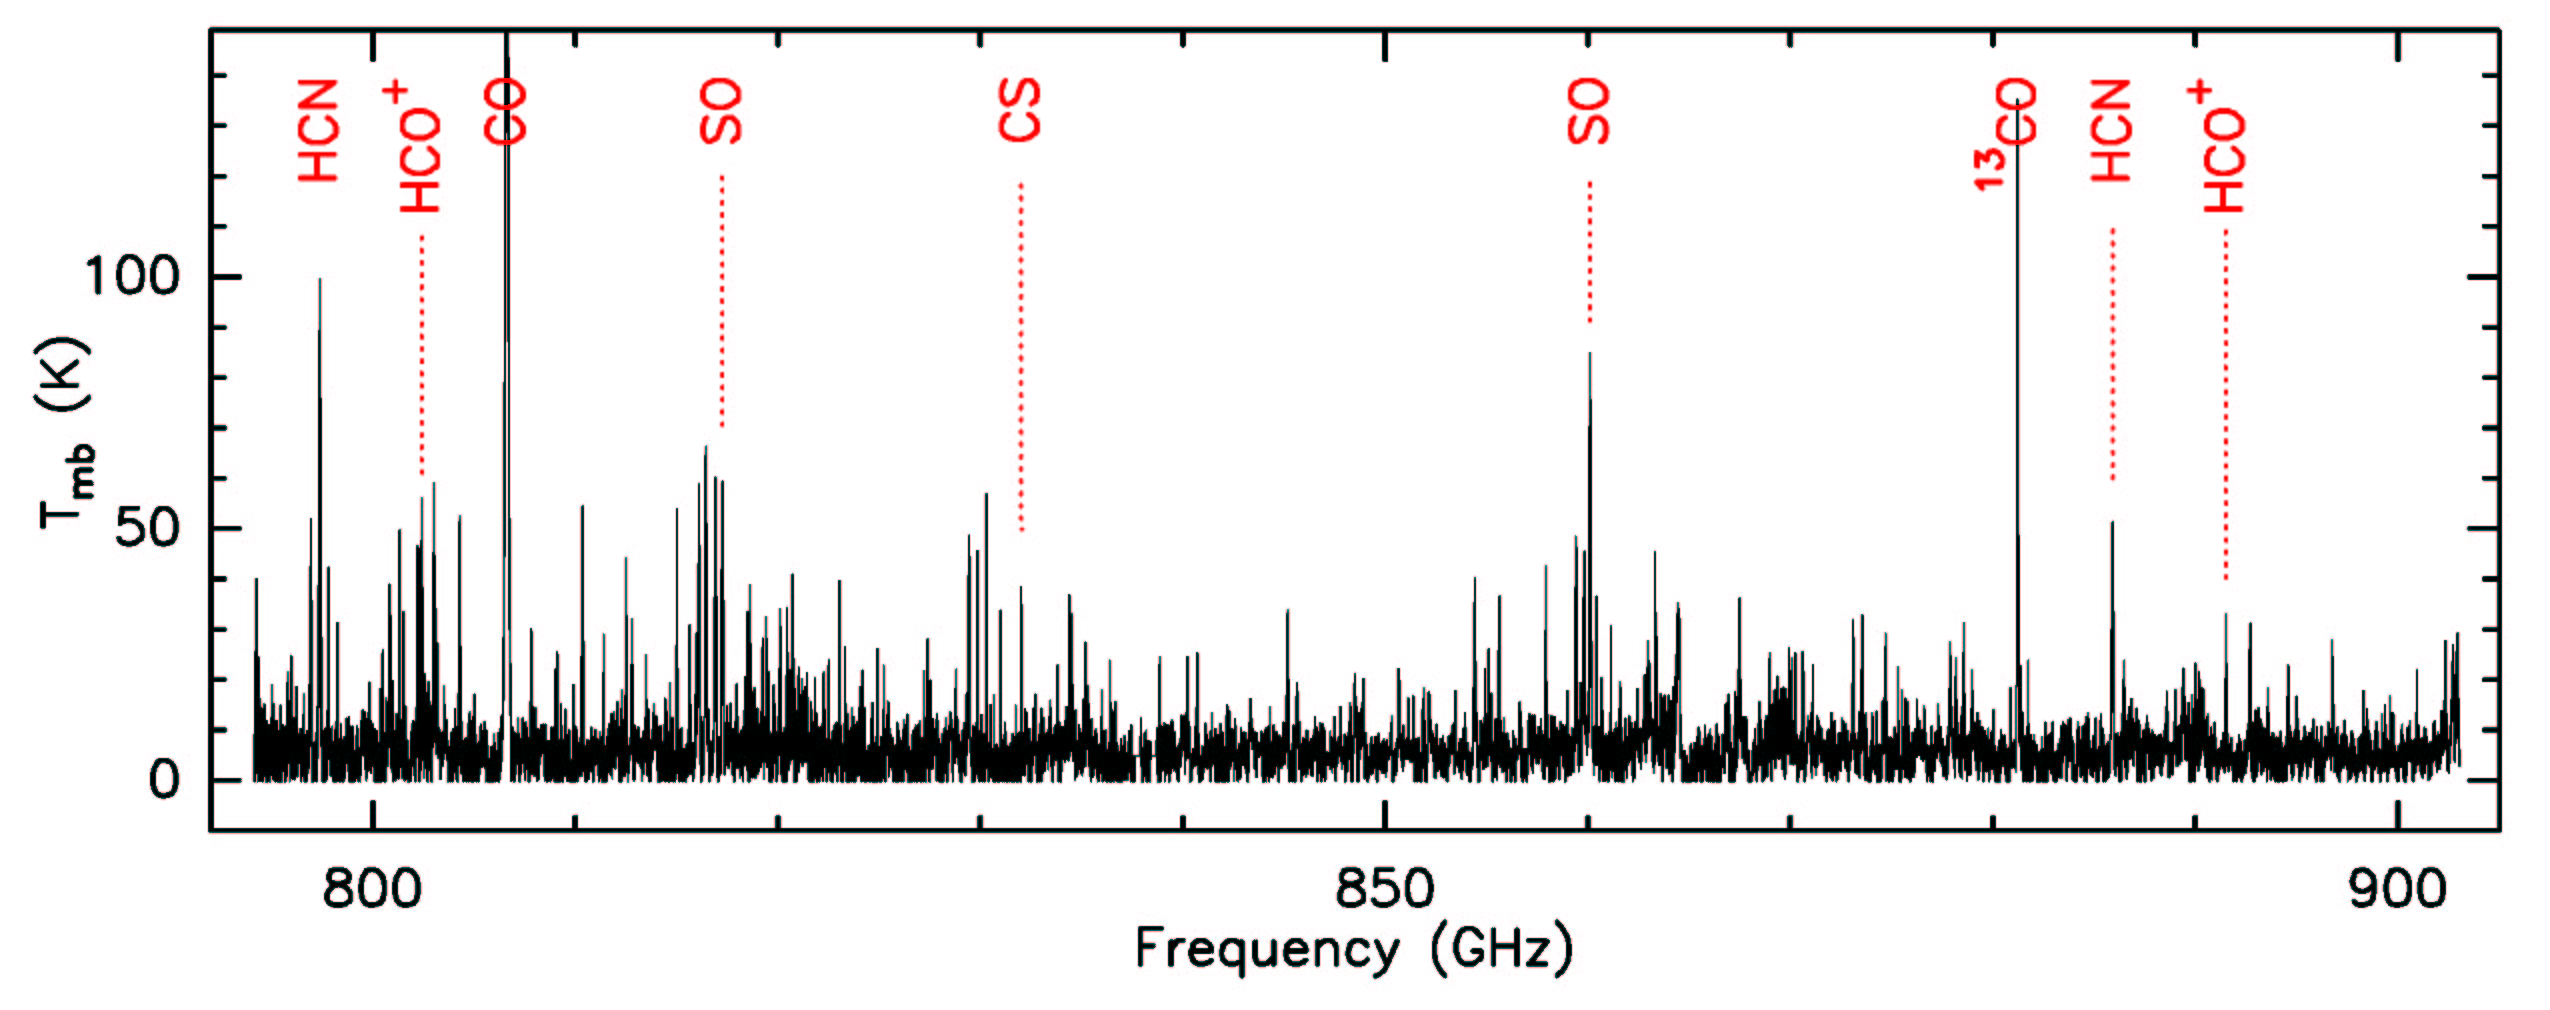
The CSO program of line surveying is now complete, for the OMC-1 cloud. Several other objects, e.g. Orion-S, IRC+10216, IRAS 16293, NGC 1333, have also been surveyed. The surveys form a reference set of spectra of great use for observers. The 790 - 900 GHz survey is in preparation (Comito et al. 2002). Although most of the molecules found at these frequencies were seen in the lower frequency surveys, the information obtained in this survey is not redundant, since for almost all species the emission lines in the submm band originate from higher energy levels than at lower frequencies, which, together with the small beam size, allows emitting gas to be traced from very small, high-density, hot sources. This, in fact, is what we find in the 607 - 725 GHz and the 790 - 900 GHz surveys. As expected, the strongest emission lines are produced by CO followed by, SO2, SO, CH3OH, HCN. Particularly interesting is the emission due to the ground-state line of singly-deuterated water (HDO).
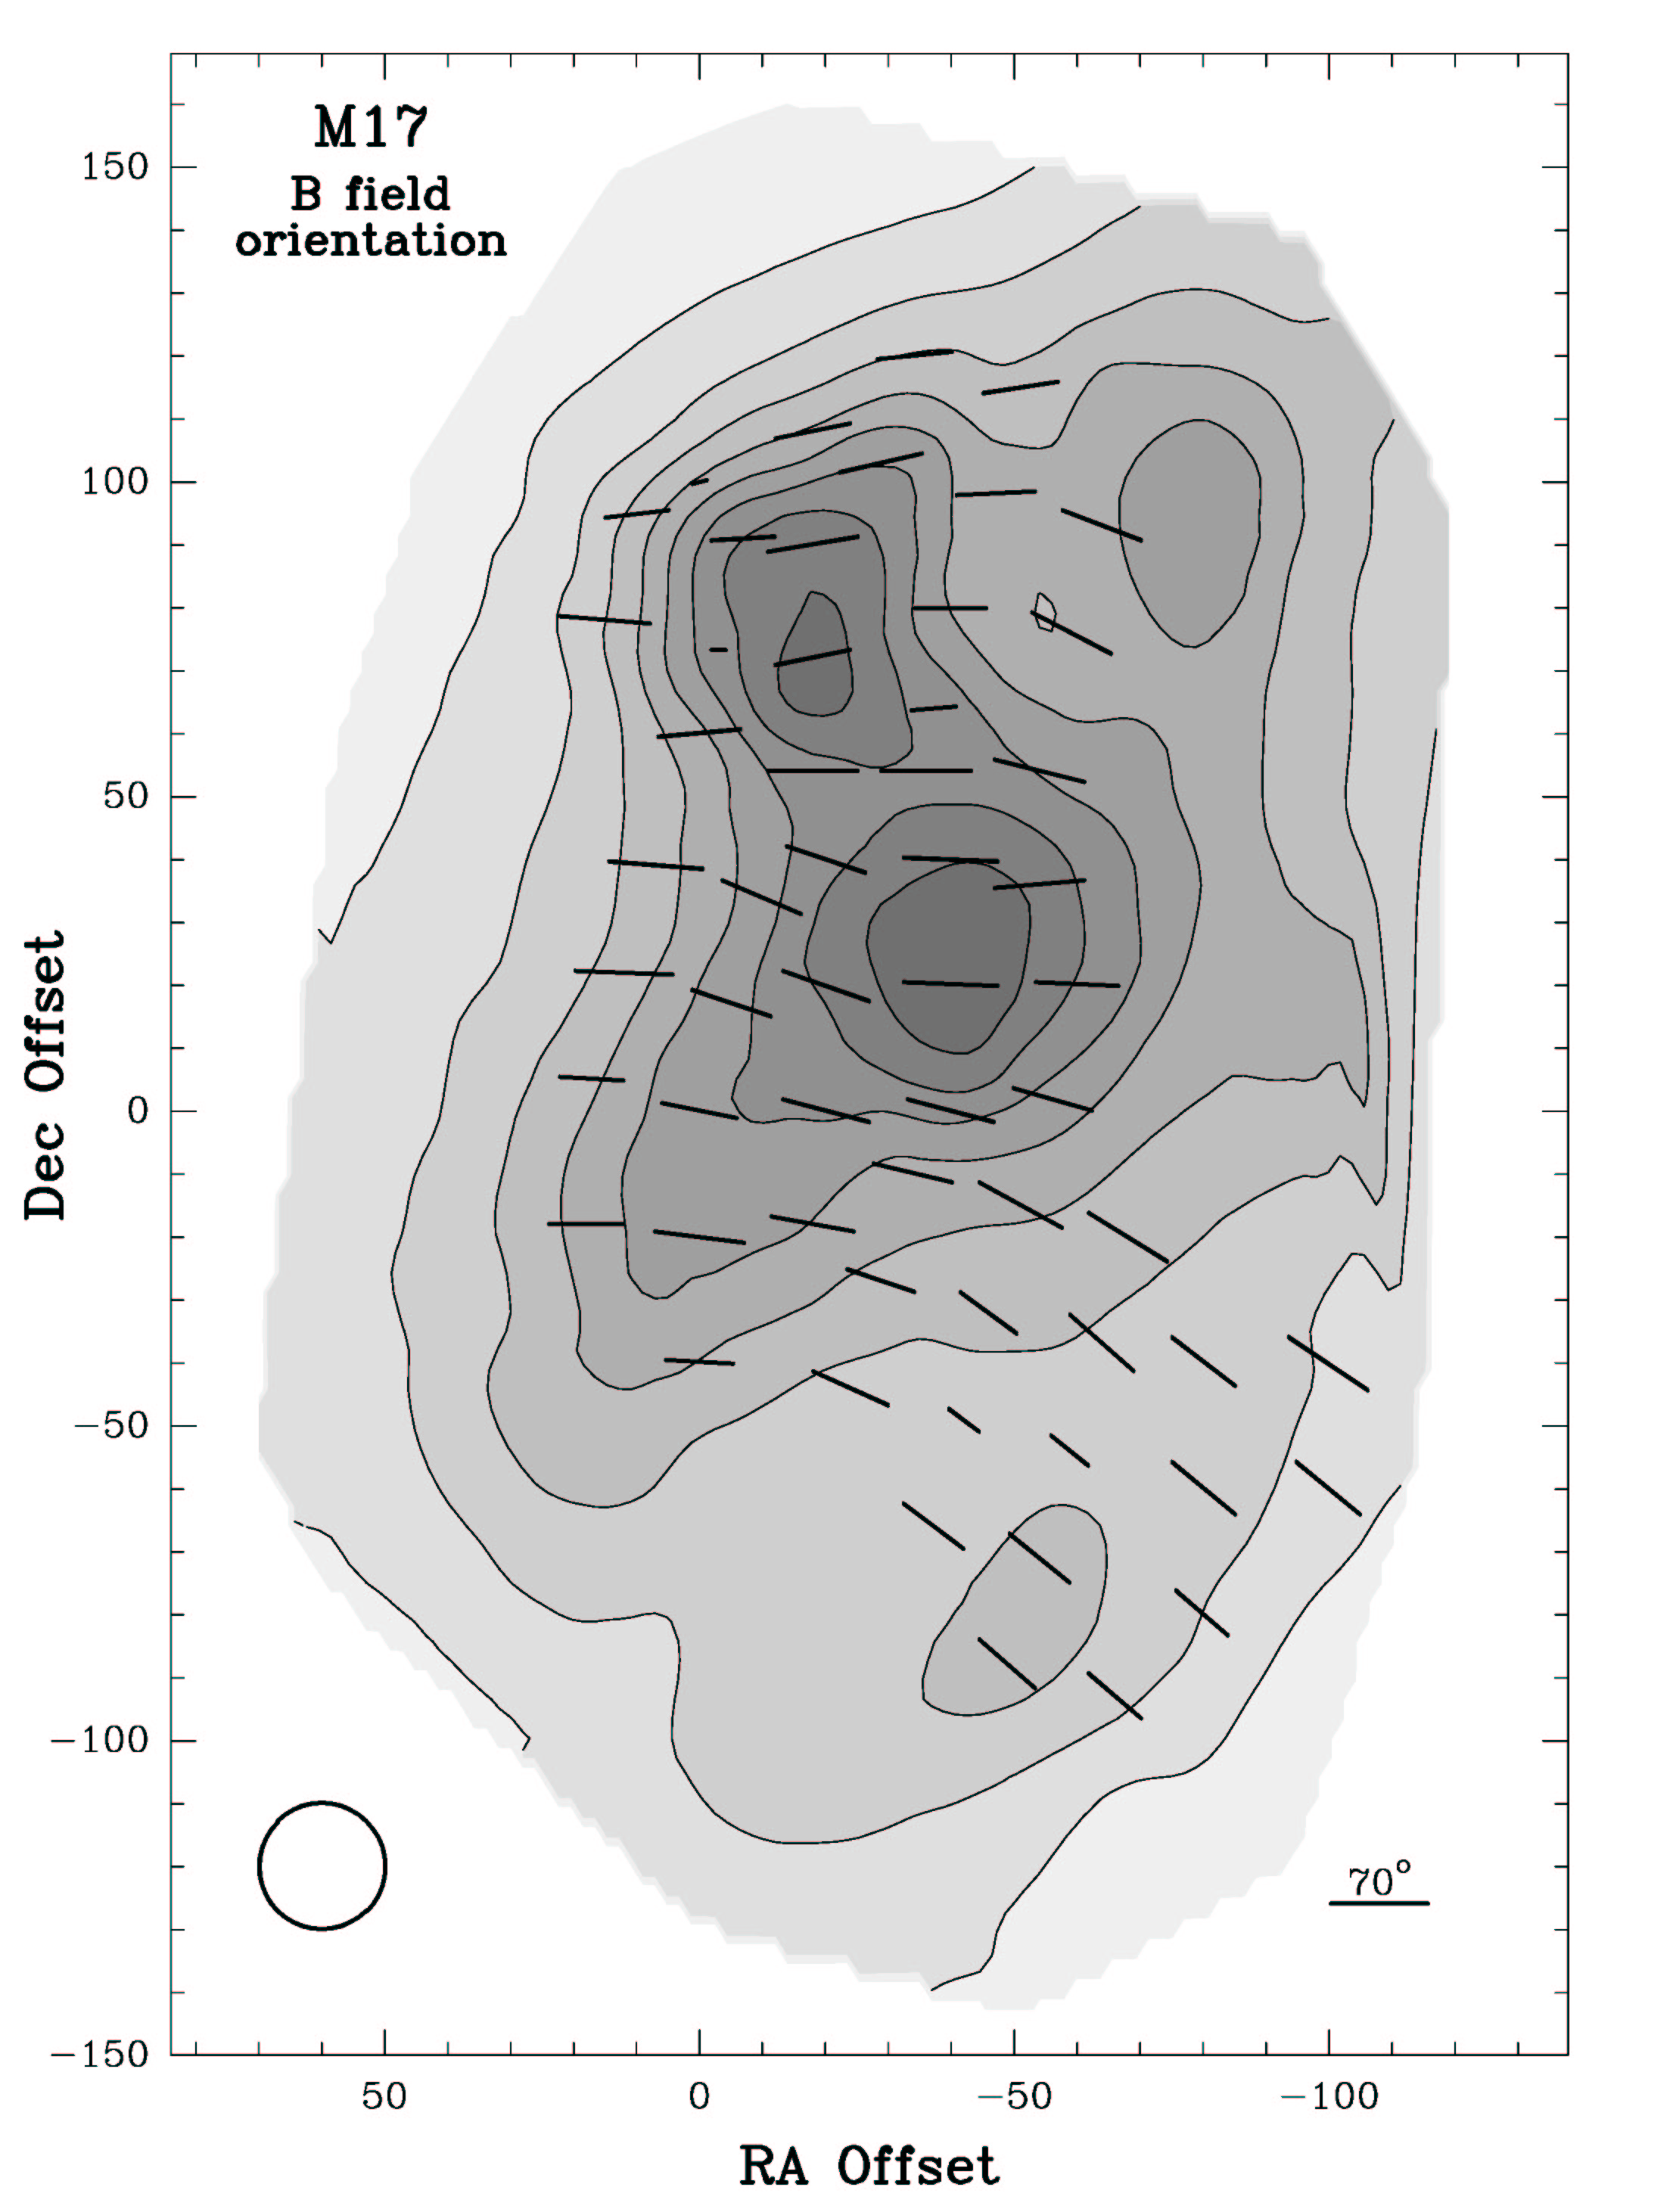 A molecular ion subjected to the influence of neutral flows and a magnetic field in weakly ionized plasma, has a line width, which, in general, should be less than that of coexistent neutral species. This is in part because the ion is likely to be trapped into an orbit around the magnetic field and therefore does not take part in the flows. This prediction was first made and tested by Houde et al. (2000a) with observations of HCO+ and HCN in four molecular clouds and later expanded to include other species and more objects in Houde et al. (2000b). This effect represents a new way to demonstrate the presence of the magnetic field in molecular clouds. The most important corollary, so far, is the realization that it is now possible to determine the orientation in space of the magnetic field in molecular clouds by combining dust polarimetry and ion-to-neutral line width ratio measurements. Furthermore, a measure of the magnitude of the magnetic field is also feasible, in principle, in cases where the field does not lie in the plane of the sky and Zeeman data are available (Houde et al. 2002). Zeeman and dust polarimetry measurements then provide the strength of the magnetic field along the line of sight and the orientation angle of the field in the plane of the sky, respectively, whereas ion-to-neutral line width ratio data hold the key to the determination of the inclination angle of the field to the line of sight. This value of the inclination angle is what was previously the missing element in attempts to obtain a three-dimensional picture of the magnetic field. We have combined dust polarimetry and ion-to-neutral line width ratio measurements and applied this technique to the M17 molecular cloud to determine, for the first time, the complete spatial orientation of the magnetic field in a molecular cloud (see figure). The orientation of the magnetic field in M17 in the plane of the sky is shown by the vectors. Its inclination to the line of sight is given by the length of the vectors (using the scale in the bottom right corner). The contours and the gray scale delineate the total 350 µm continuum flux. The beam width (20") is shown in the lower left corner.
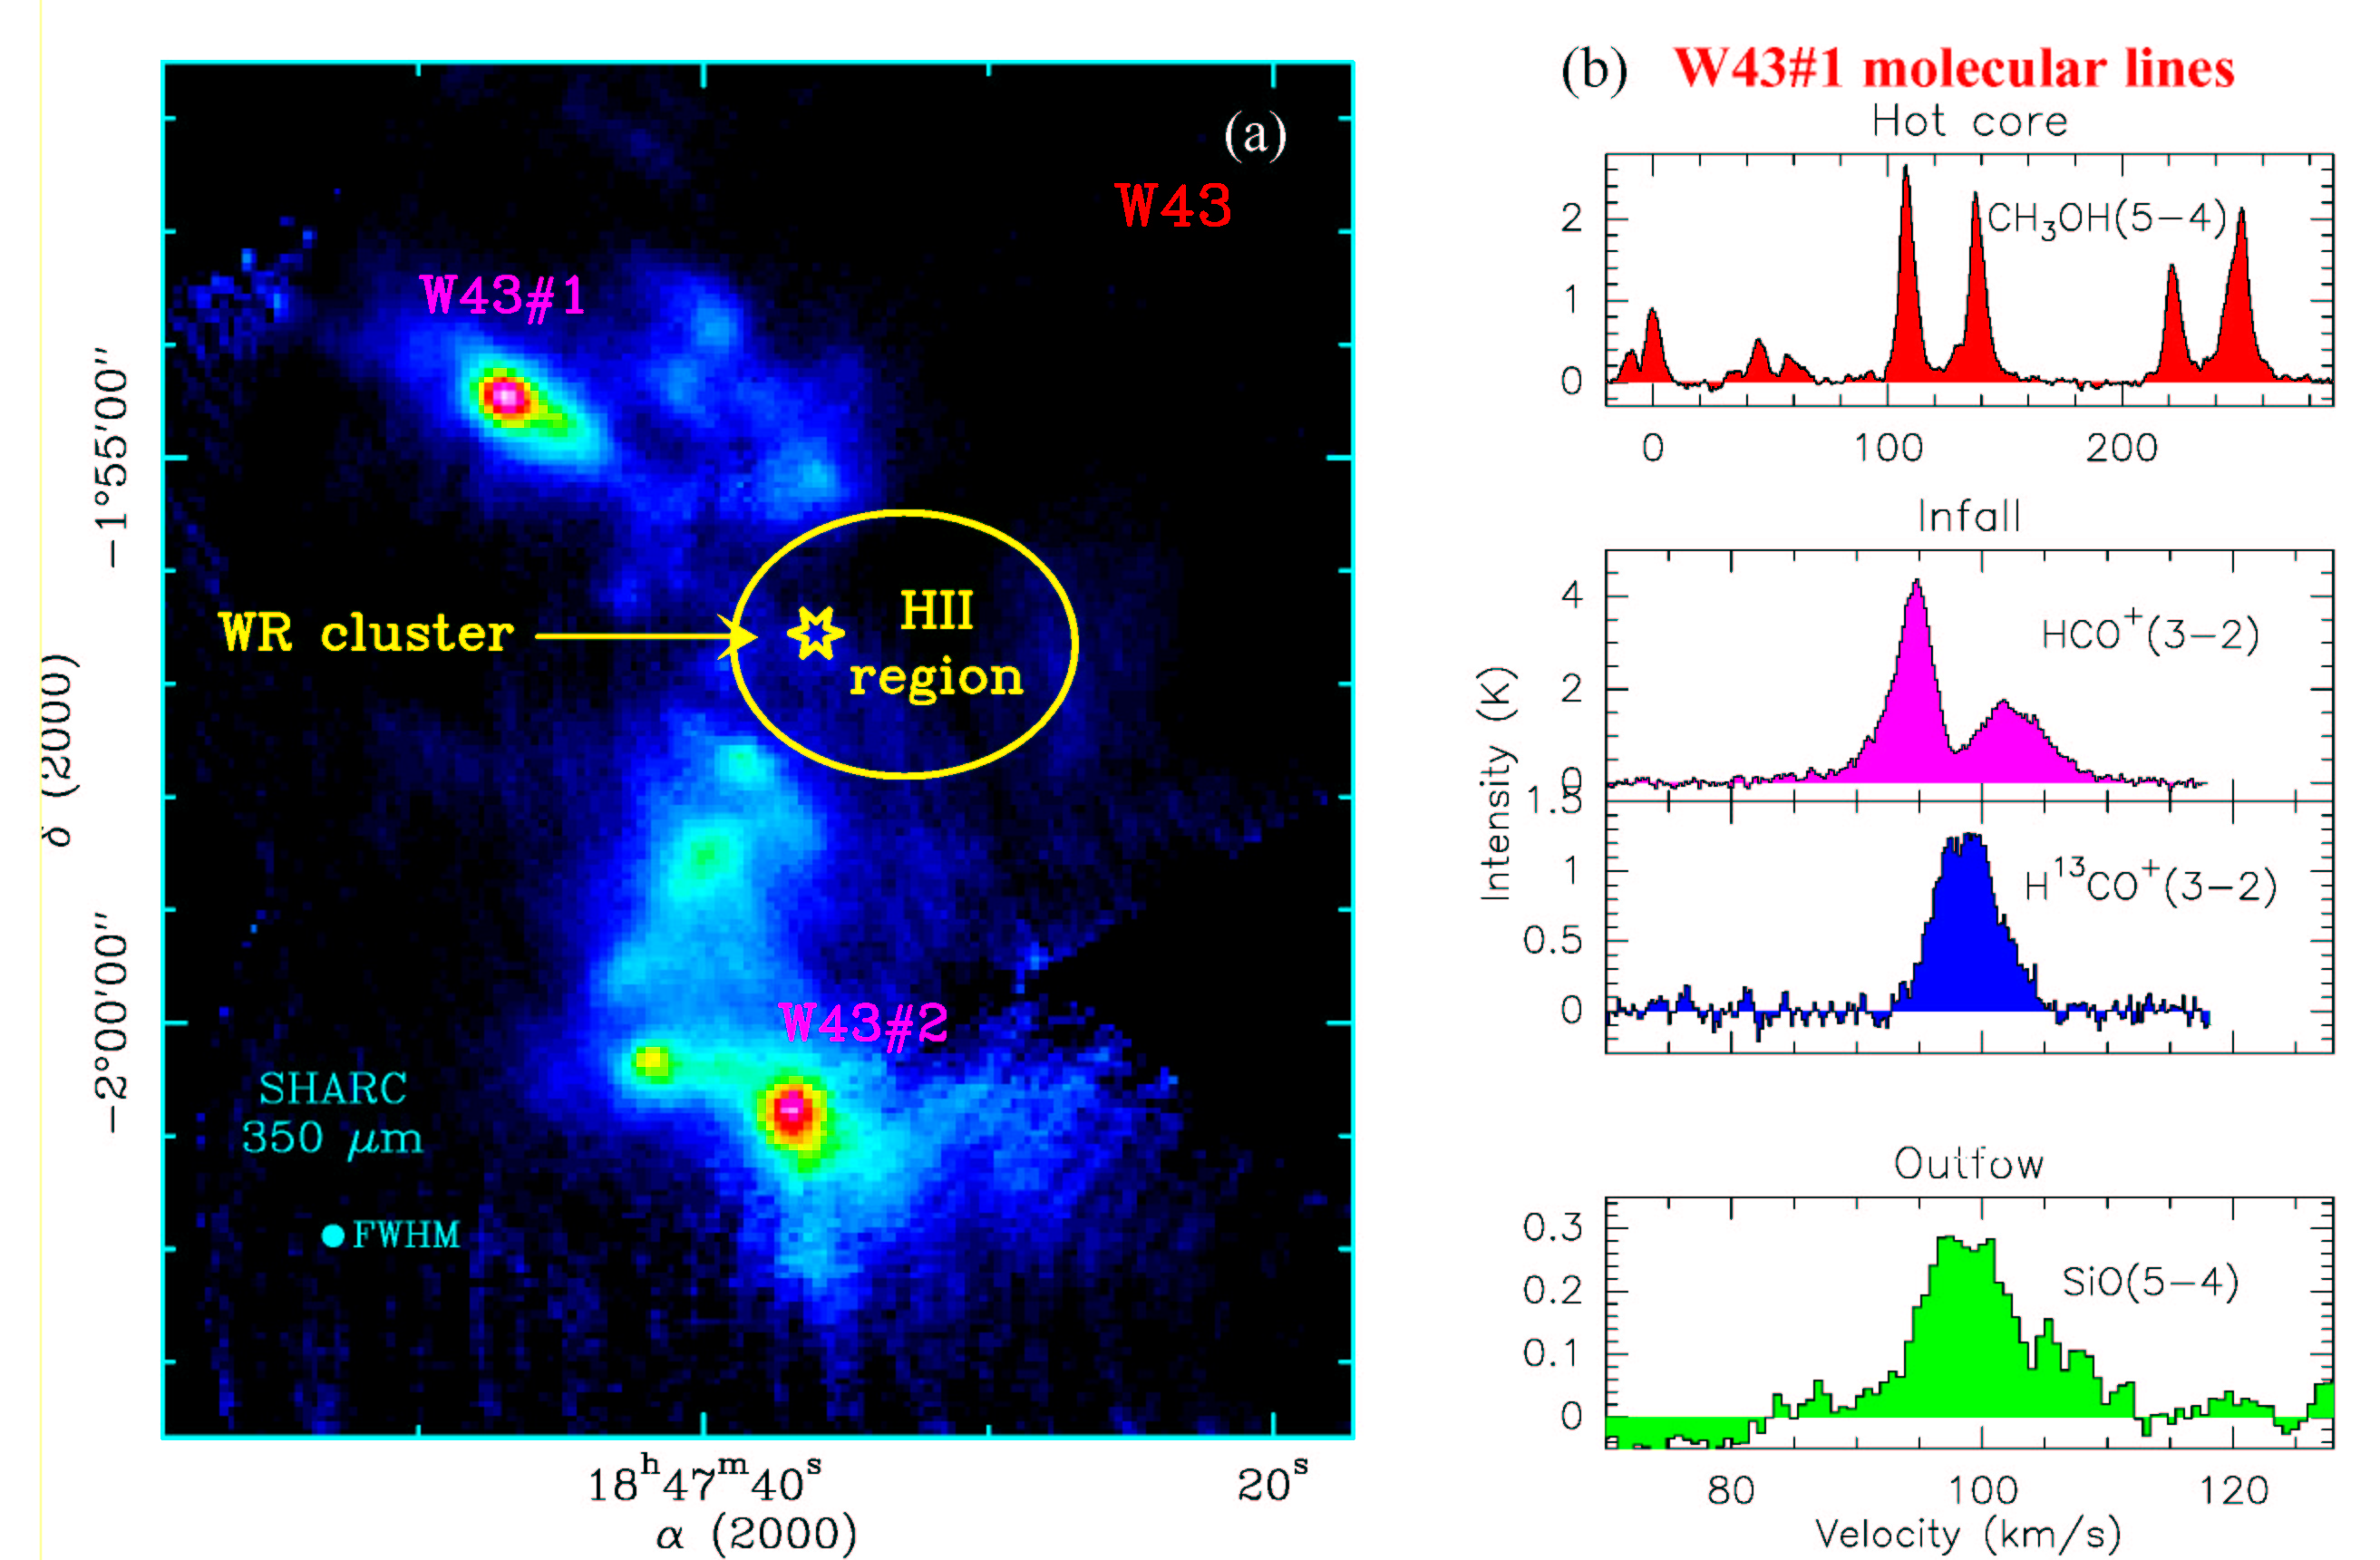
A fundamental, yet unresolved issue is the determination of the main physical process leading to the formation of massive stars. A massive star could build through accretion, but only if the accretion rate is high enough to overcome the radiation pressure. As an alternative to accretion, massive stars may form through the coalescence of lower mass protostars. In an effort to constrain the kinematics of the protoclusters identified in a SHARC image of W43 (see figure a), Motte et al. (2002) have mapped those protoclusters harboring massive protostars in the HCO+ (3-2) and H13CO+ (3-2) emission. Strikingly, the HCO+ lines observed toward five protoclusters show redshifted self-absorption, suggesting that these protoclusters are contracting over very large scales (see figure b).Using a two-layer contracting-cloud model (Myers et al. 1996), inward velocities of ~1kms-1 are derived at the peak positions of W43 #1 and #2. This is the fastest, and the only supersonic infall ever observed on parsec scales in star-forming regions. If this inward motion continues at small scales, high-mass protostars embedded within these protoclusters could accrete at a rate as high as 10-3 Msun yr-1. In such a case, protostellar accretion could be the main physical process responsible for massive star formation, at least in the W43 protoclusters.